Measurement of the J/$\psi $ photoproduction cross section over the full near-threshold kinematic region
Abstract:
We report the total and differential cross sections for $J/\psi$ photoproduction with the large acceptance GlueX spectrometer for photon beam energies from the threshold at 8.2 GeV up to 11.44 GeV and over the full kinematic range of momentum transfer squared, $t$. Such coverage facilitates the extrapolation of the differential cross sections to the forward ($t = 0$) point beyond the physical region. The forward cross section is used by many theoretical models and plays an important role in understanding $J/\psi$ photoproduction and its relation to the $J/\psi-$proton interaction. These measurements of $J/\psi$ photoproduction near threshold are also crucial inputs to theoretical models that are used to study important aspects of the gluon structure of the proton, such as the gluon Generalized Parton Distribution (GPD) of the proton, the mass radius of the proton, and the trace anomaly contribution to the proton mass. We observe possible structures in the total cross section energy dependence and find evidence for contributions beyond gluon exchange in the differential cross section close to threshold, both of which are consistent with contributions from open-charm intermediate states.Journal: Phys. Rev. C108, 025201 (2023)
arXiv: arXiv:2304.03845
HEPdata: link
Phys. Rev. C108, 025201 (2023): downloads png pdf |
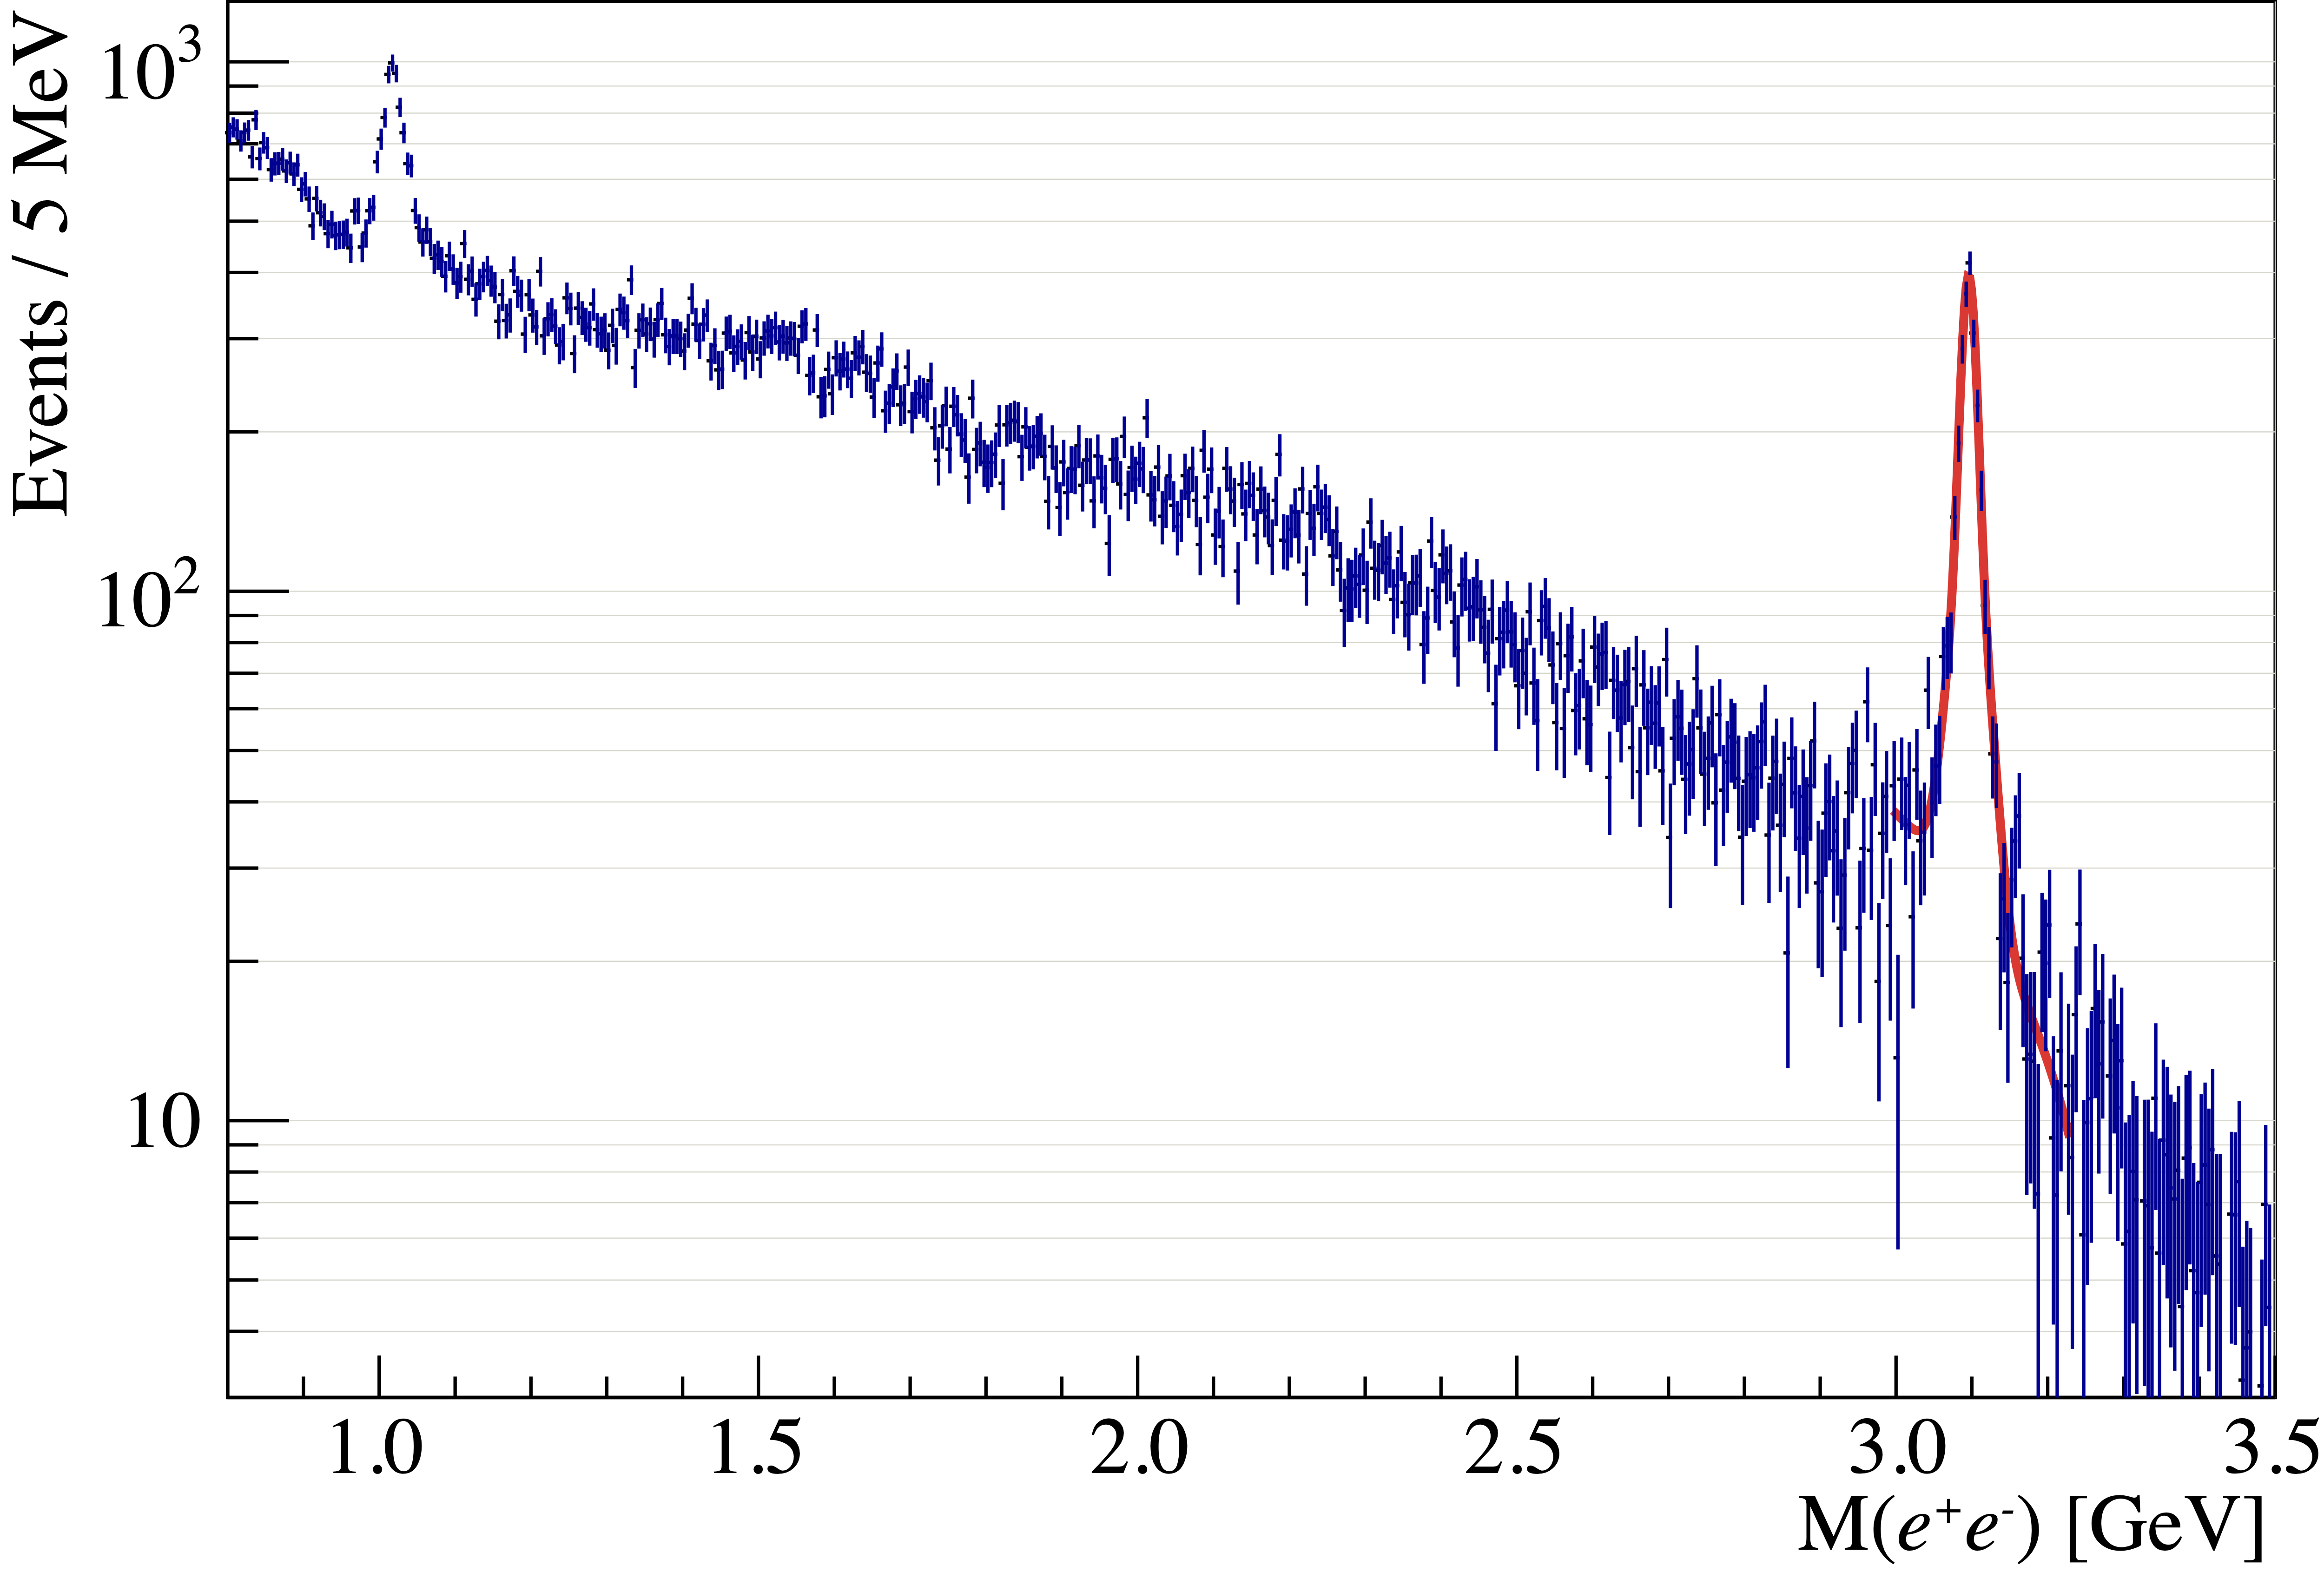
Figure 1:
The $e^+e^-$ invariant mass spectrum for the GlueX Phase-I data set after applying the selections described in Section III. The $J/\psi $ peak is fitted with a linear function and two Gaussians with common mean, which yields a total of $2270 \pm 58$ $J/\psi $'s. |
Phys. Rev. C108, 025201 (2023): downloads png pdf |
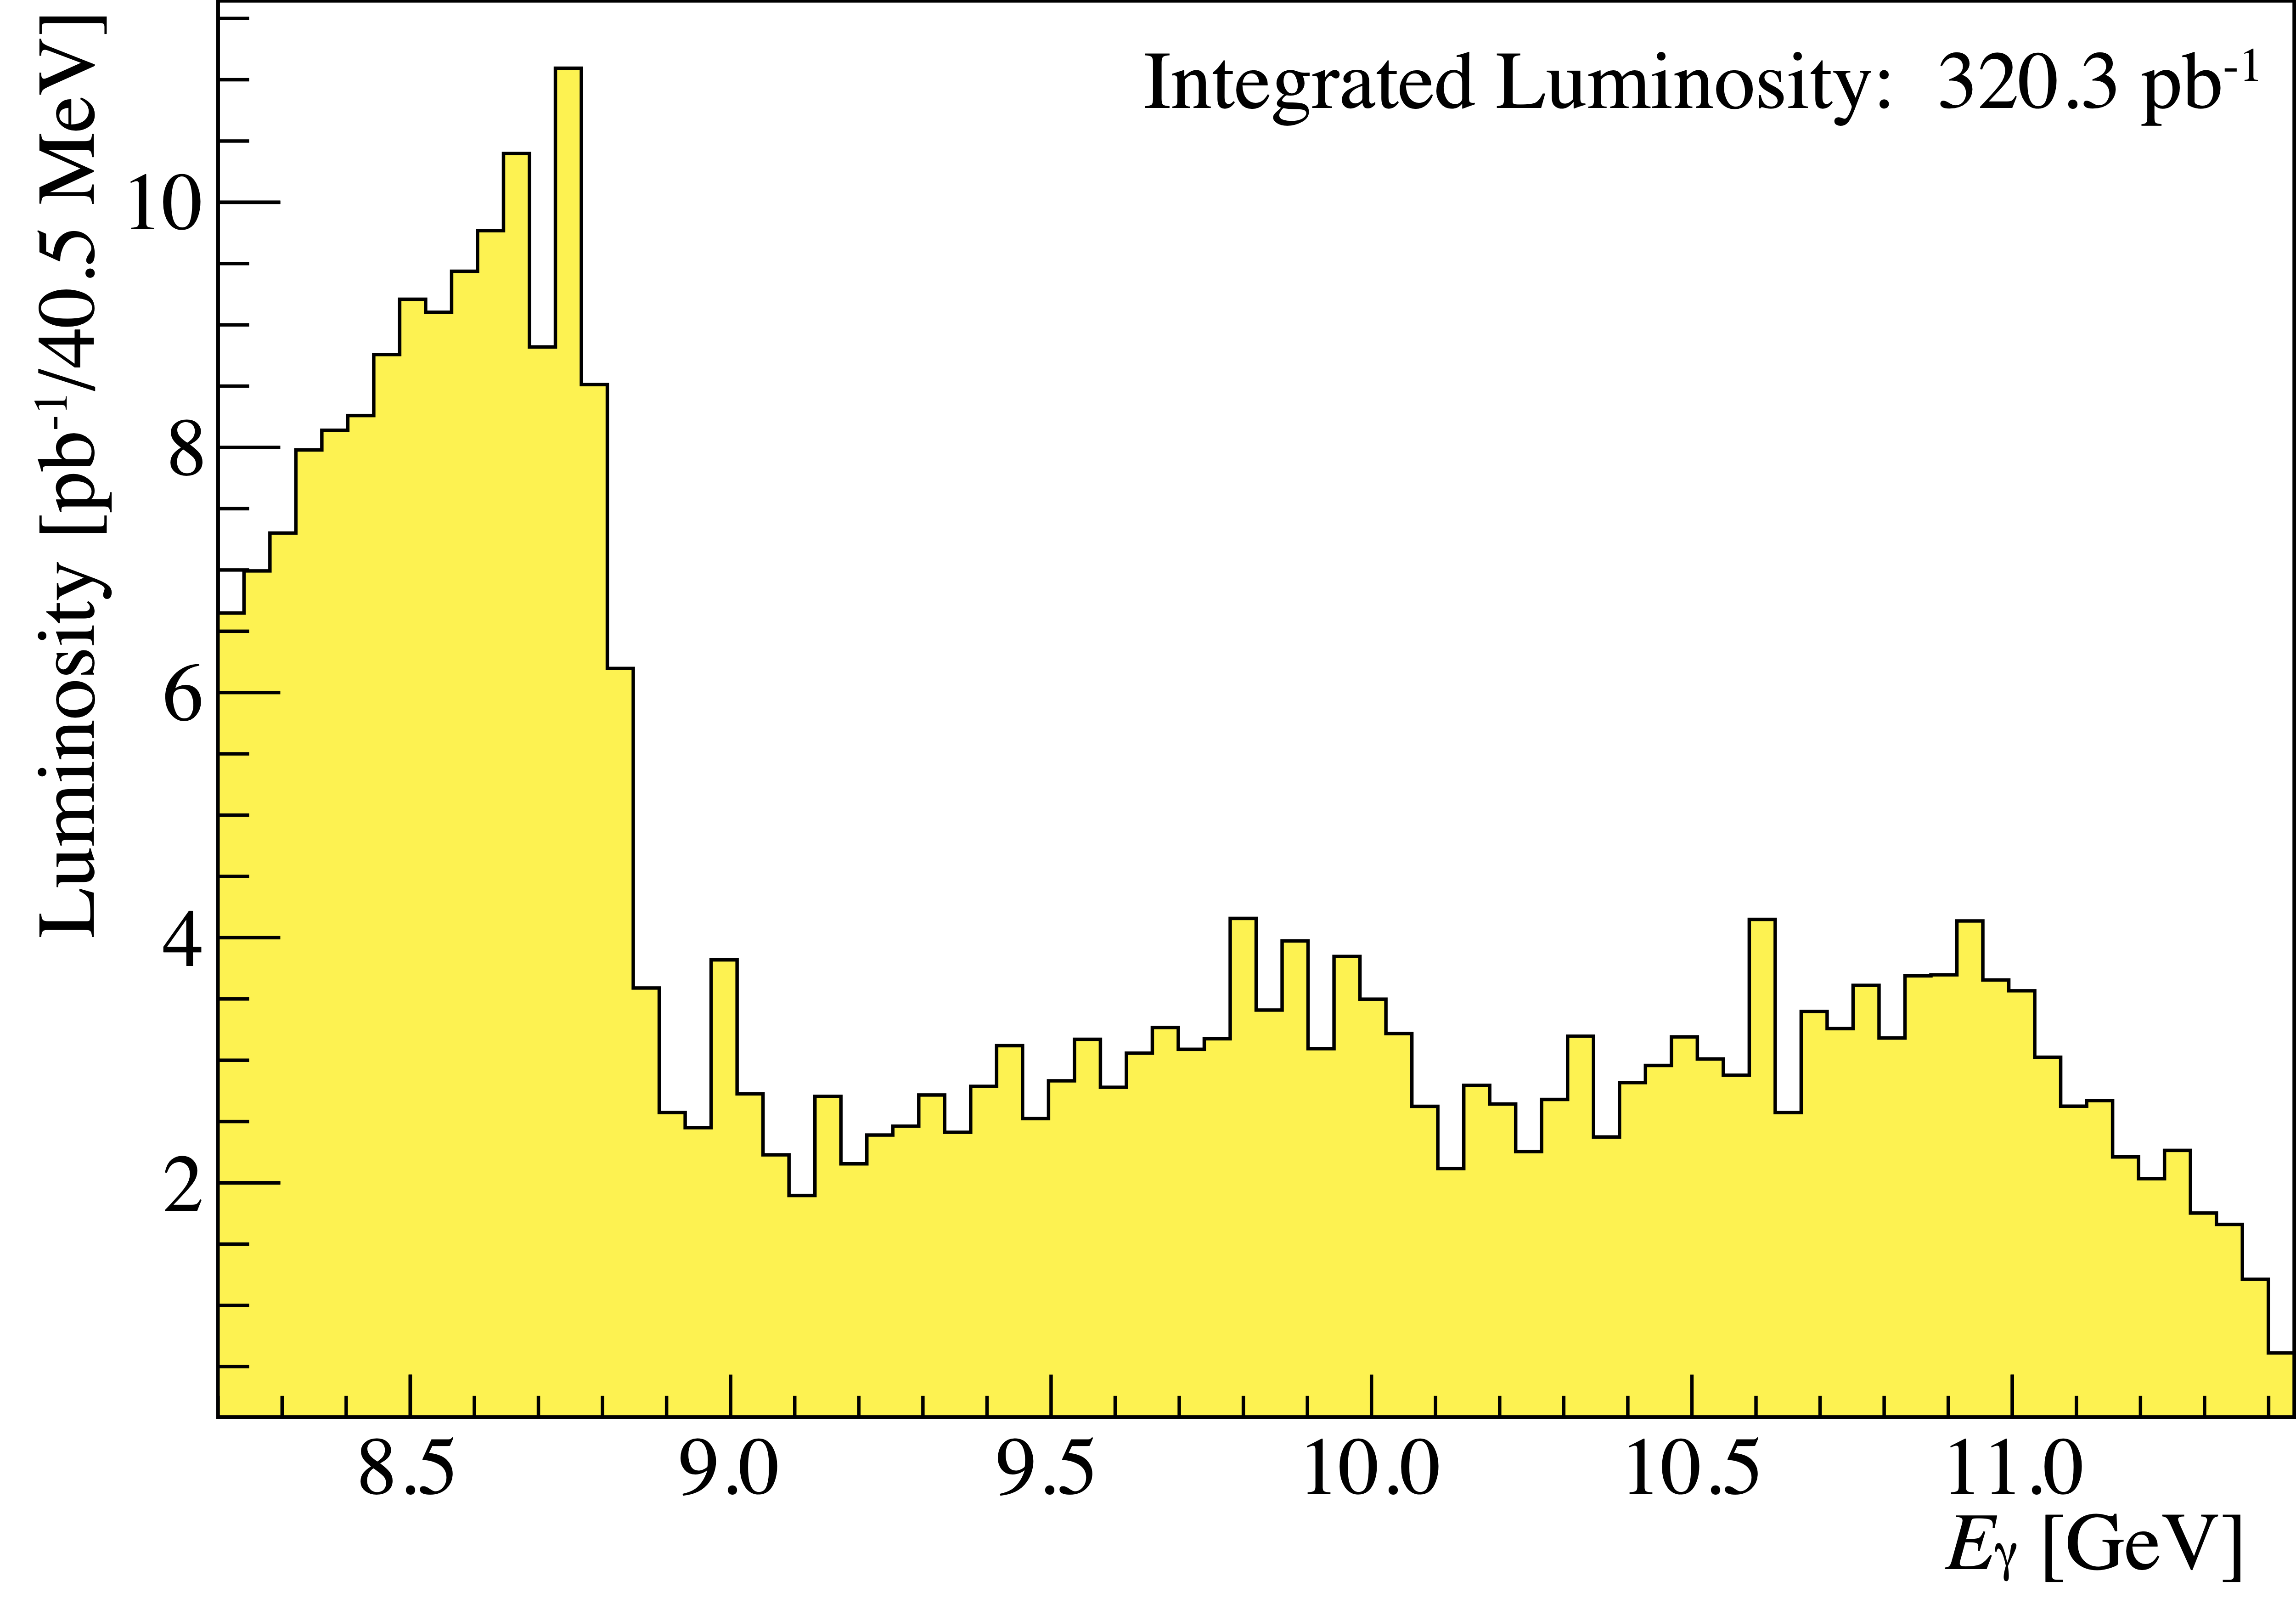
Figure 2:
The measured tagged photon spectrum for GlueX Phase-I in units of luminosity. The non-statistical fluctuations are due to the segmentation of the tagger. |
Phys. Rev. C108, 025201 (2023): downloads png pdf |
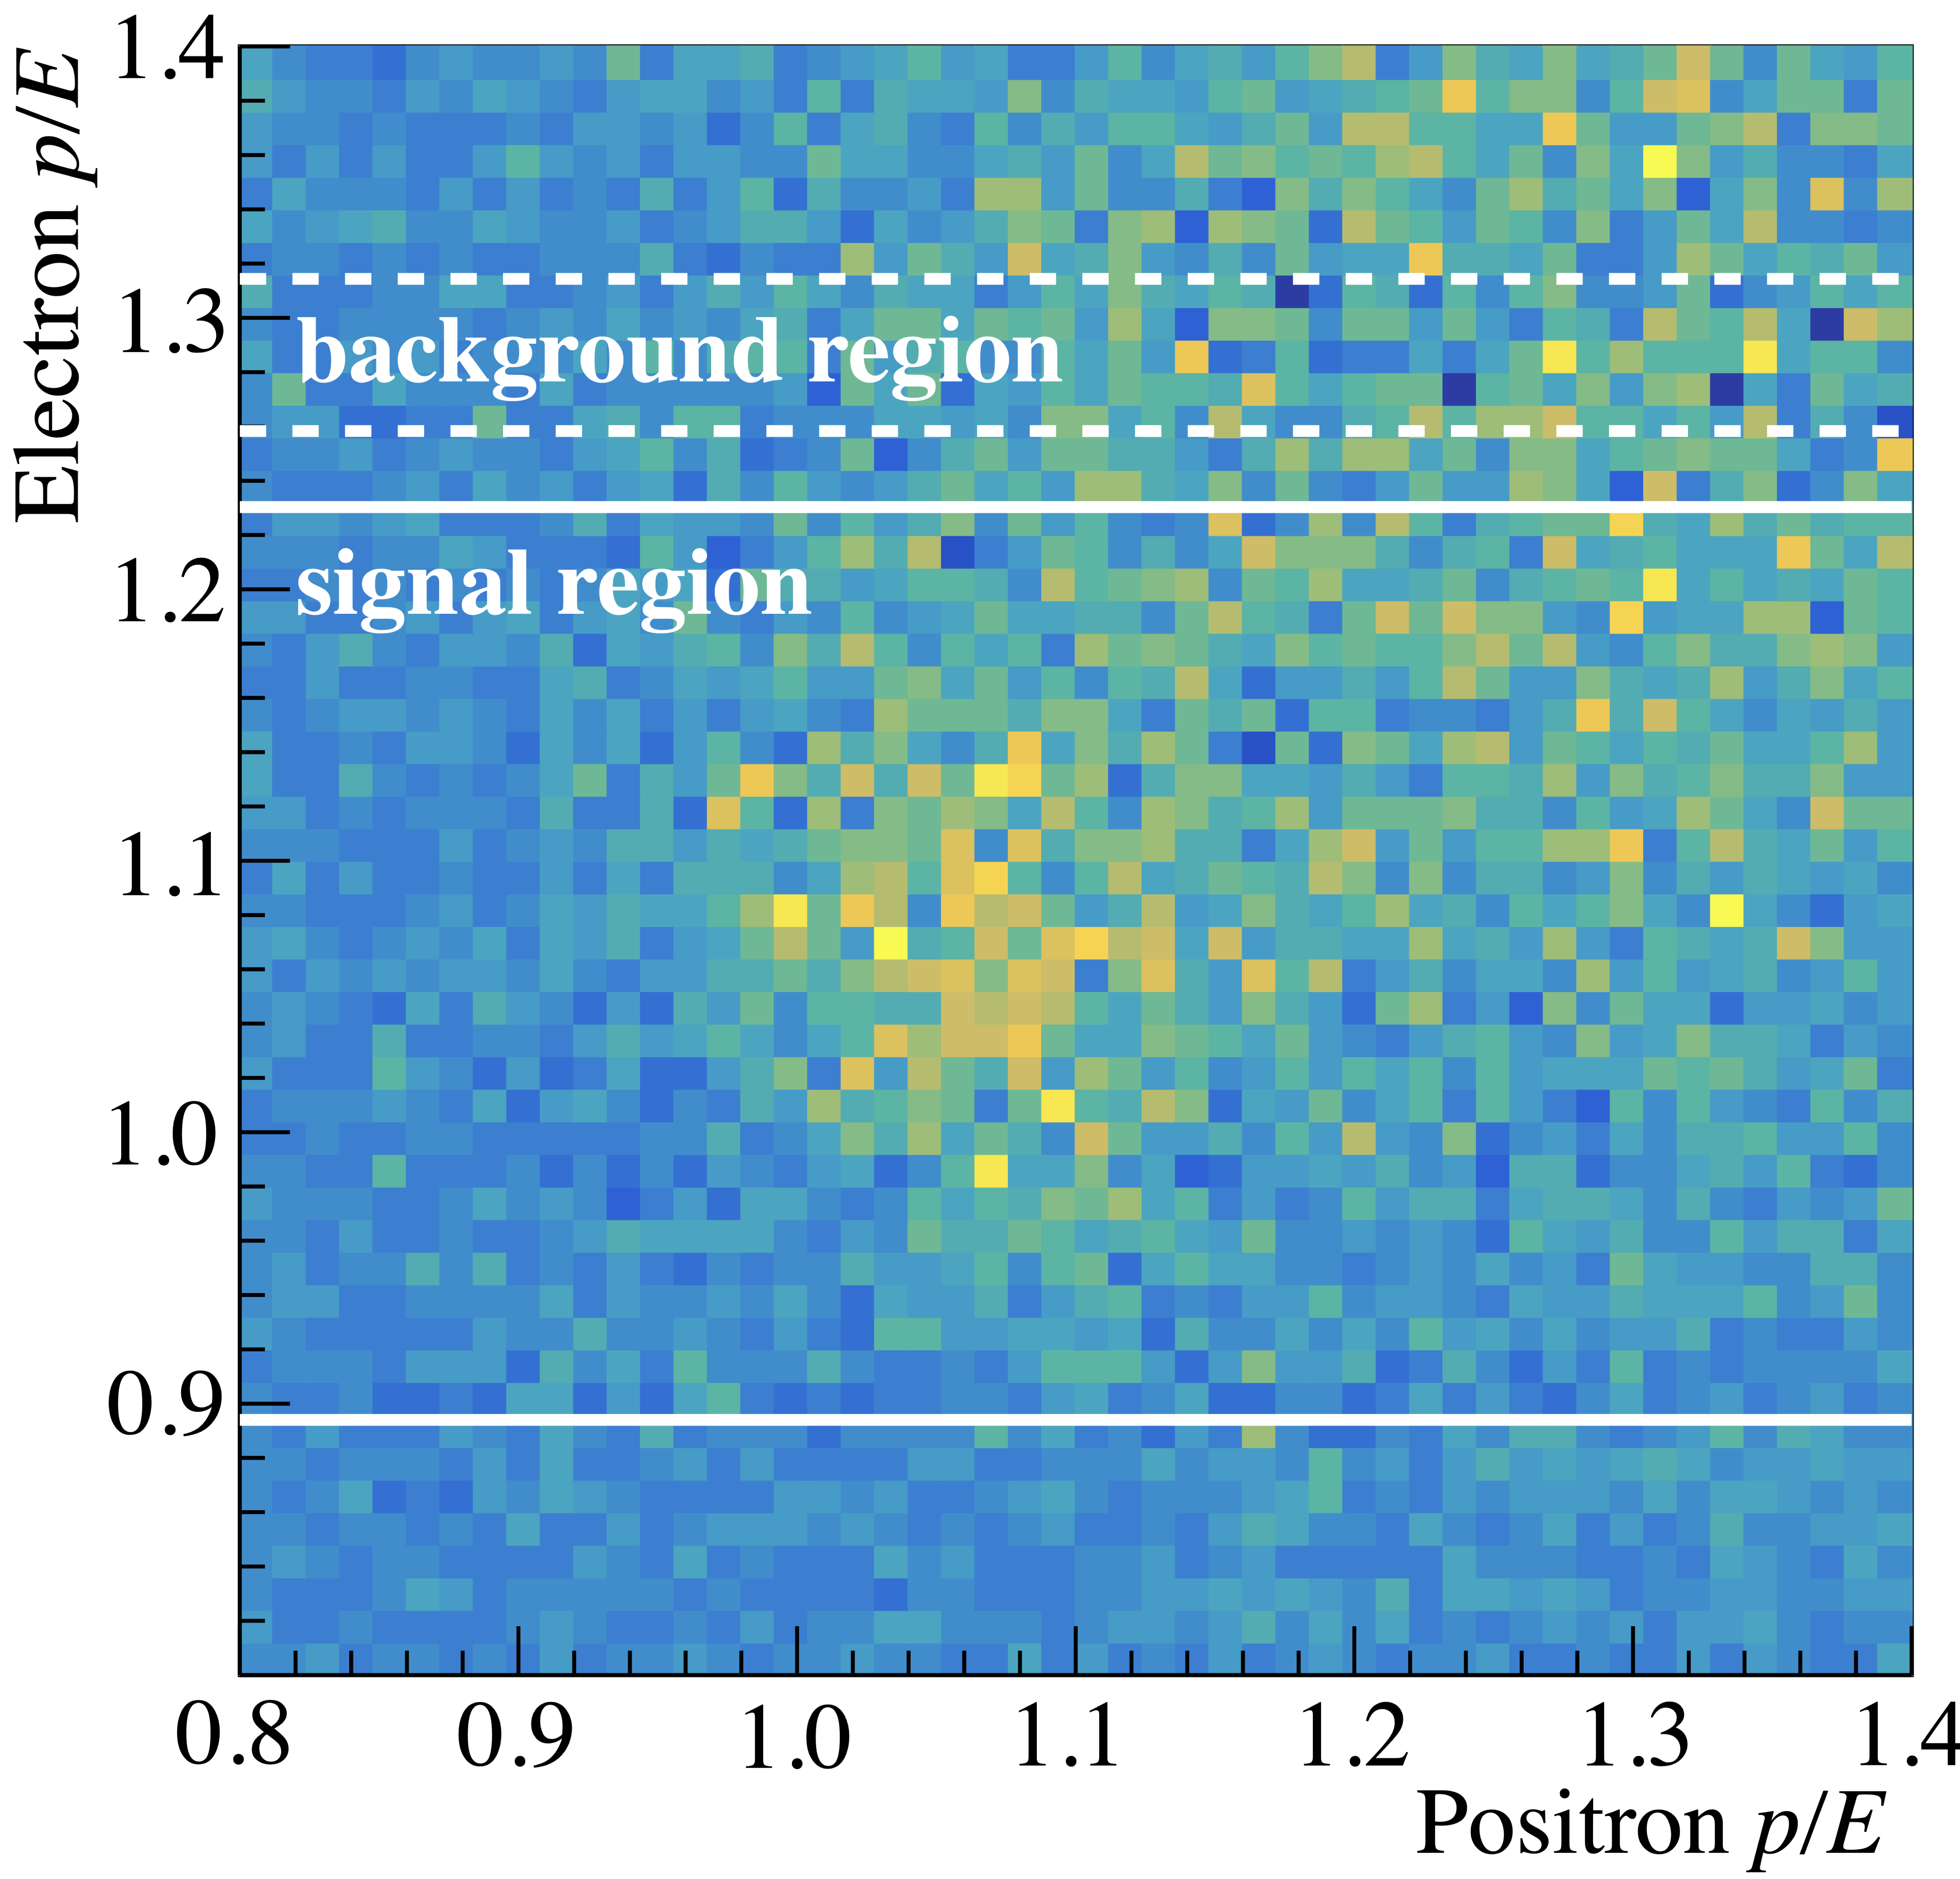
Figure 3:
Electron vs. positron $p/E$ distribution in the BH invariant mass region of $1.2-2.5$ GeV. The white horizontal lines indicate the background and signal regions used when projecting onto the positron axis. See text for explanations. |
Phys. Rev. C108, 025201 (2023): downloads png pdf |
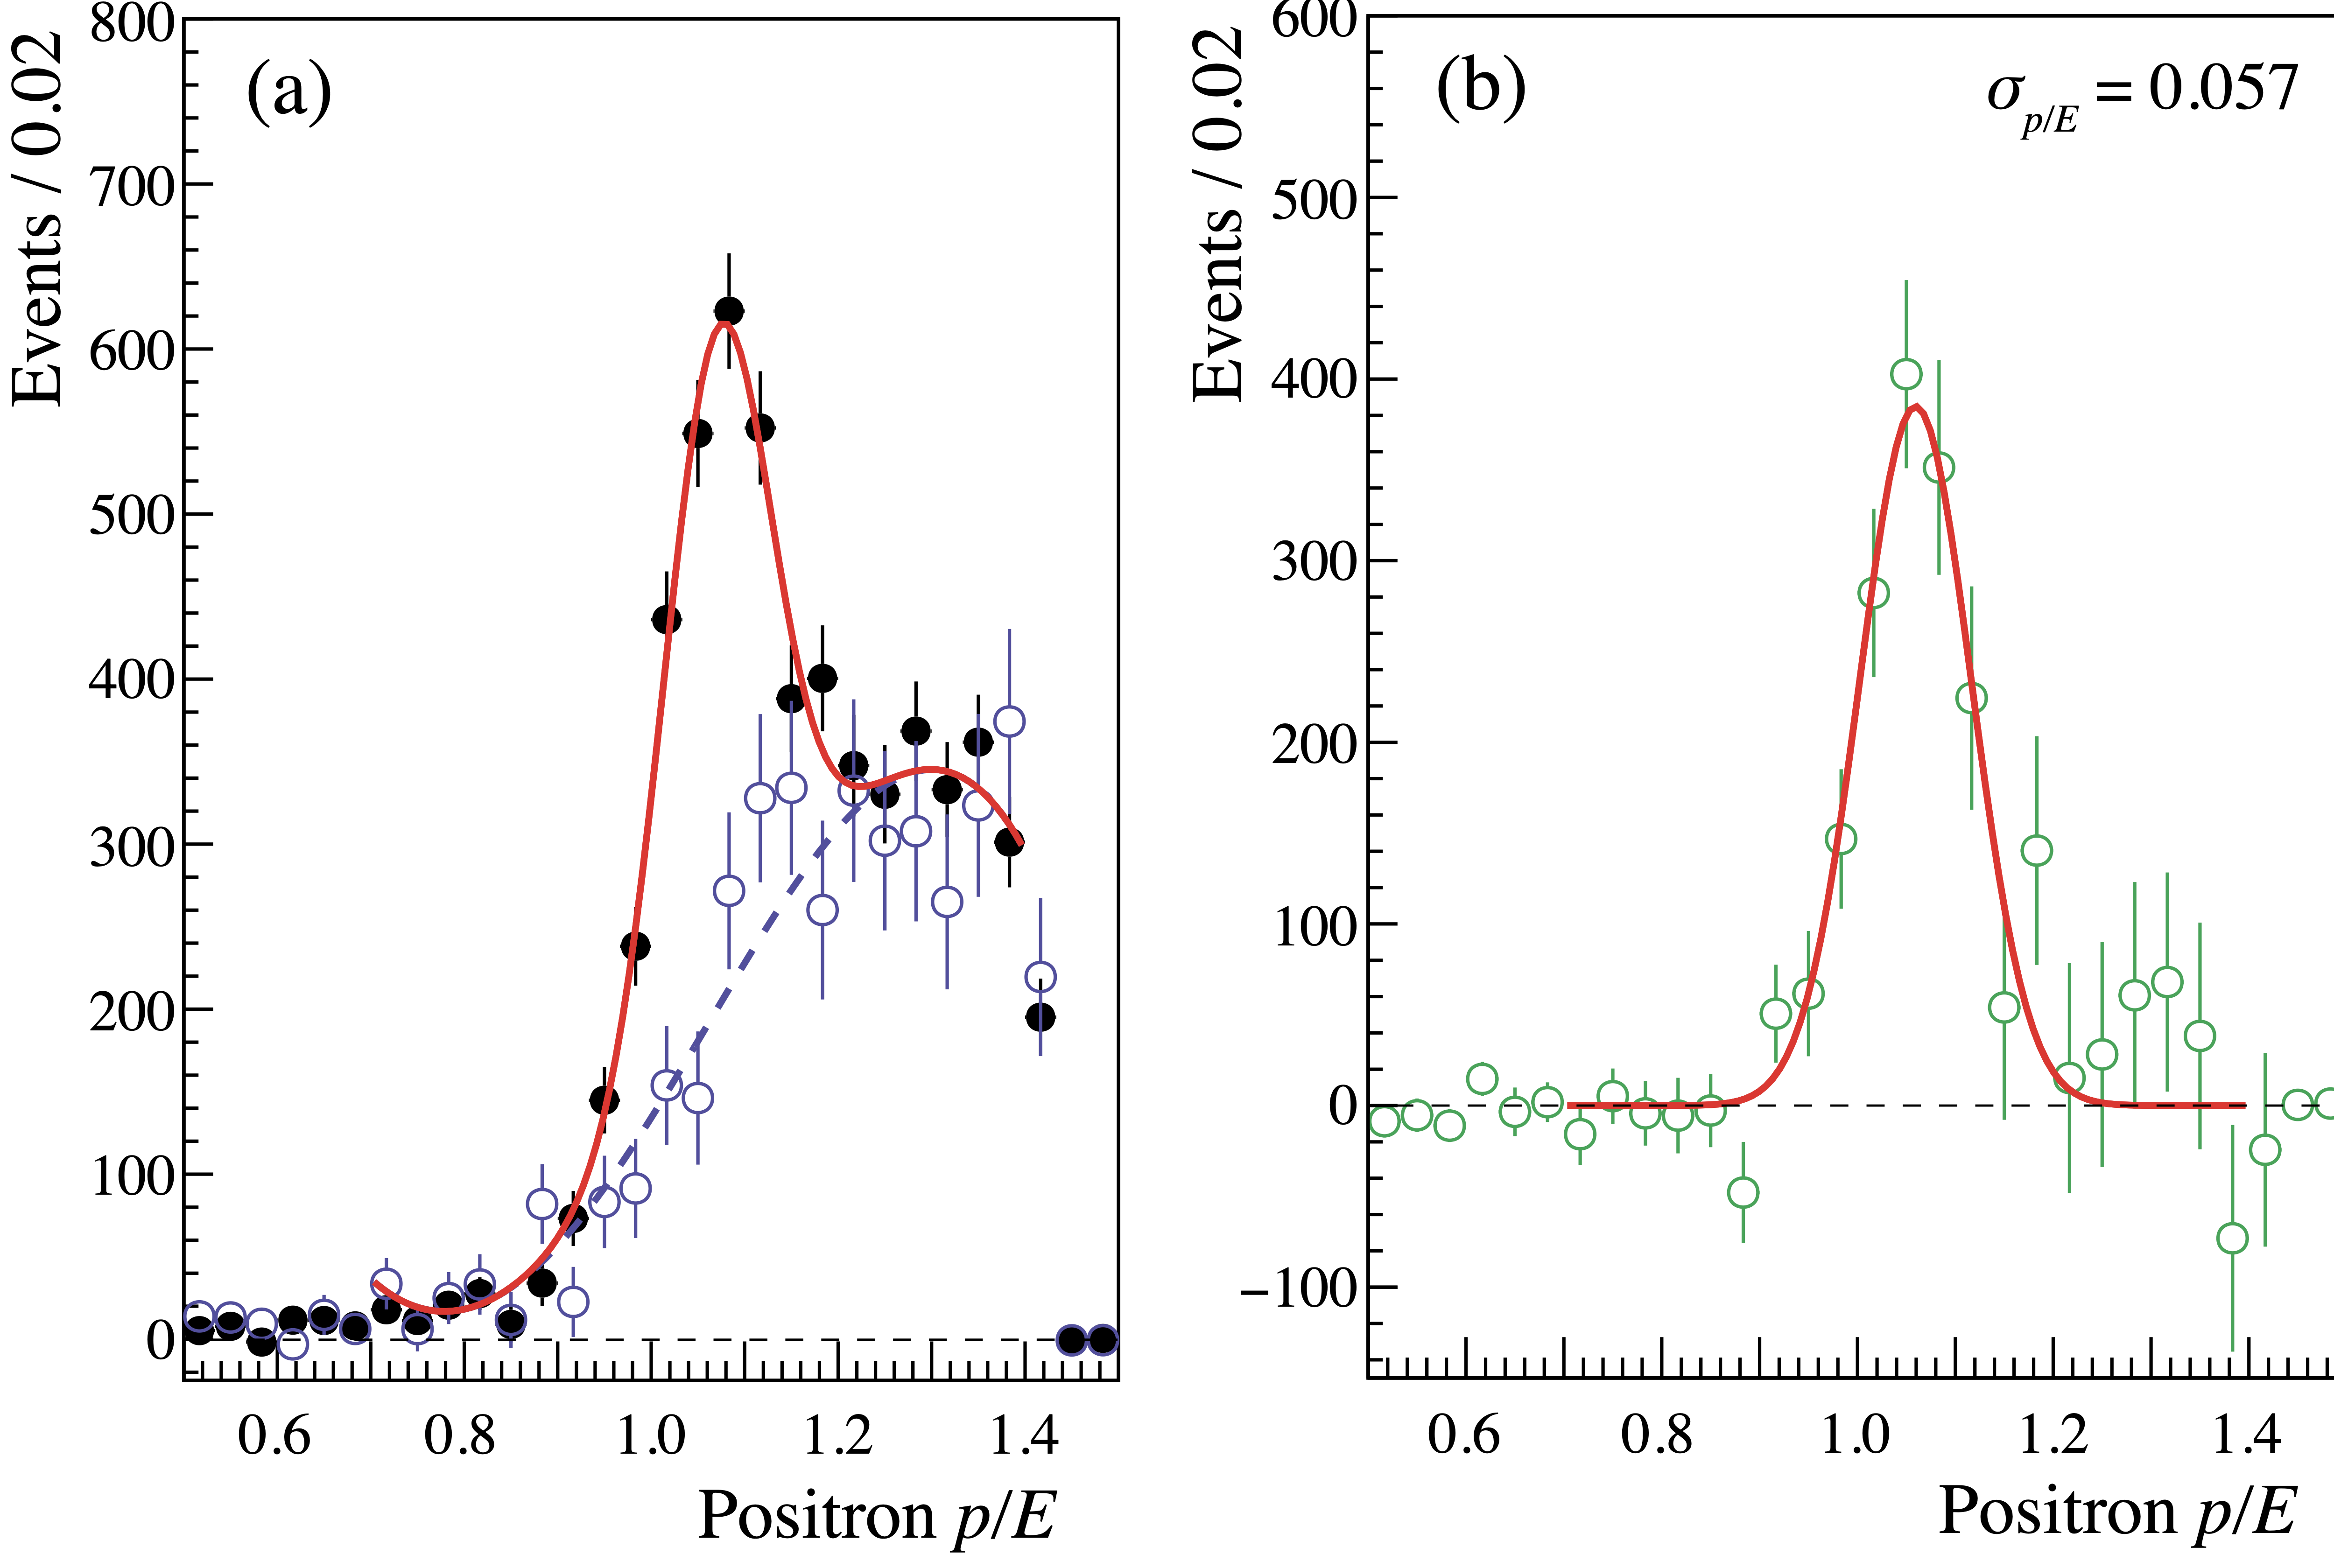
Figure 4:
(a) The $p/E$ distributions in the signal (solid black) and background (open blue) region for the BH invariant mass region of $1.2-2.5$ GeV. (b) The difference between the signal and background distributions from (a). See text for explanation of the fits. |
Phys. Rev. C108, 025201 (2023): downloads png pdf |
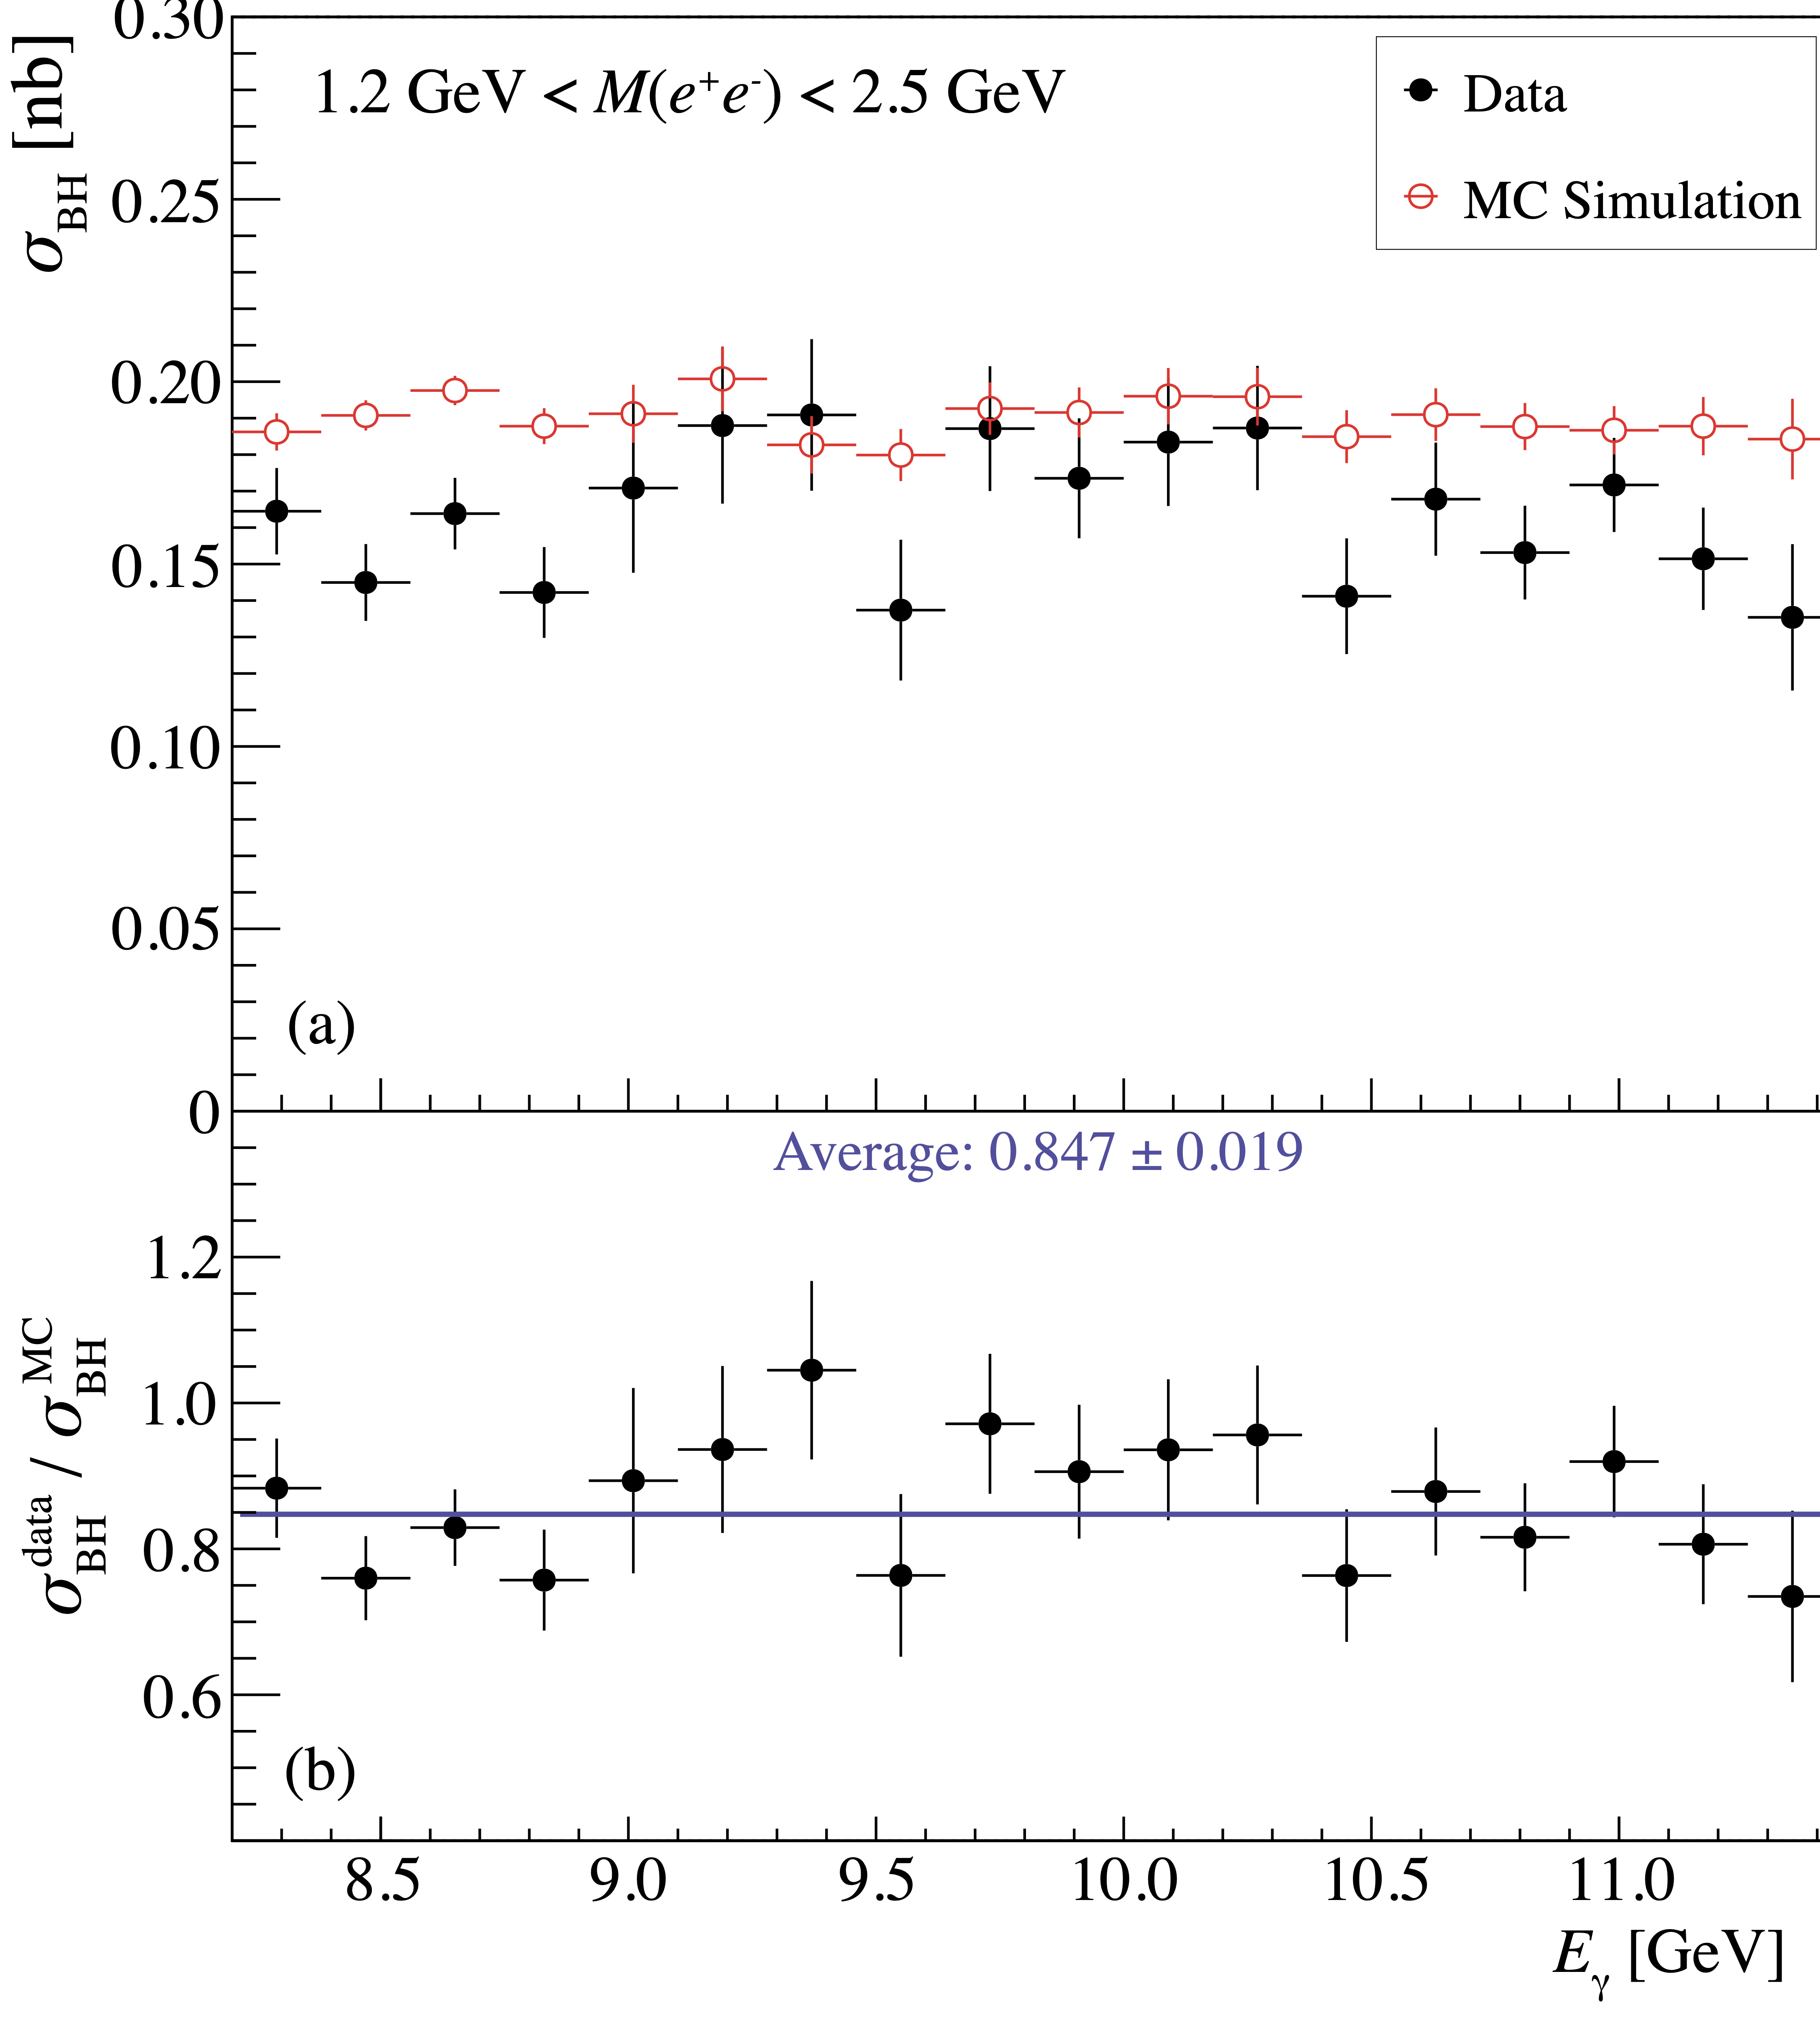
Figure 5:
BH cross section vs. beam photon energy for $1.2 < M(e^+e^-)<2.5$ GeV. (a) BH cross section obtained from data and MC simulation. (b) Ratio of data and MC cross sections from (a) fitted with a constant. |
Phys. Rev. C108, 025201 (2023): downloads png pdf |
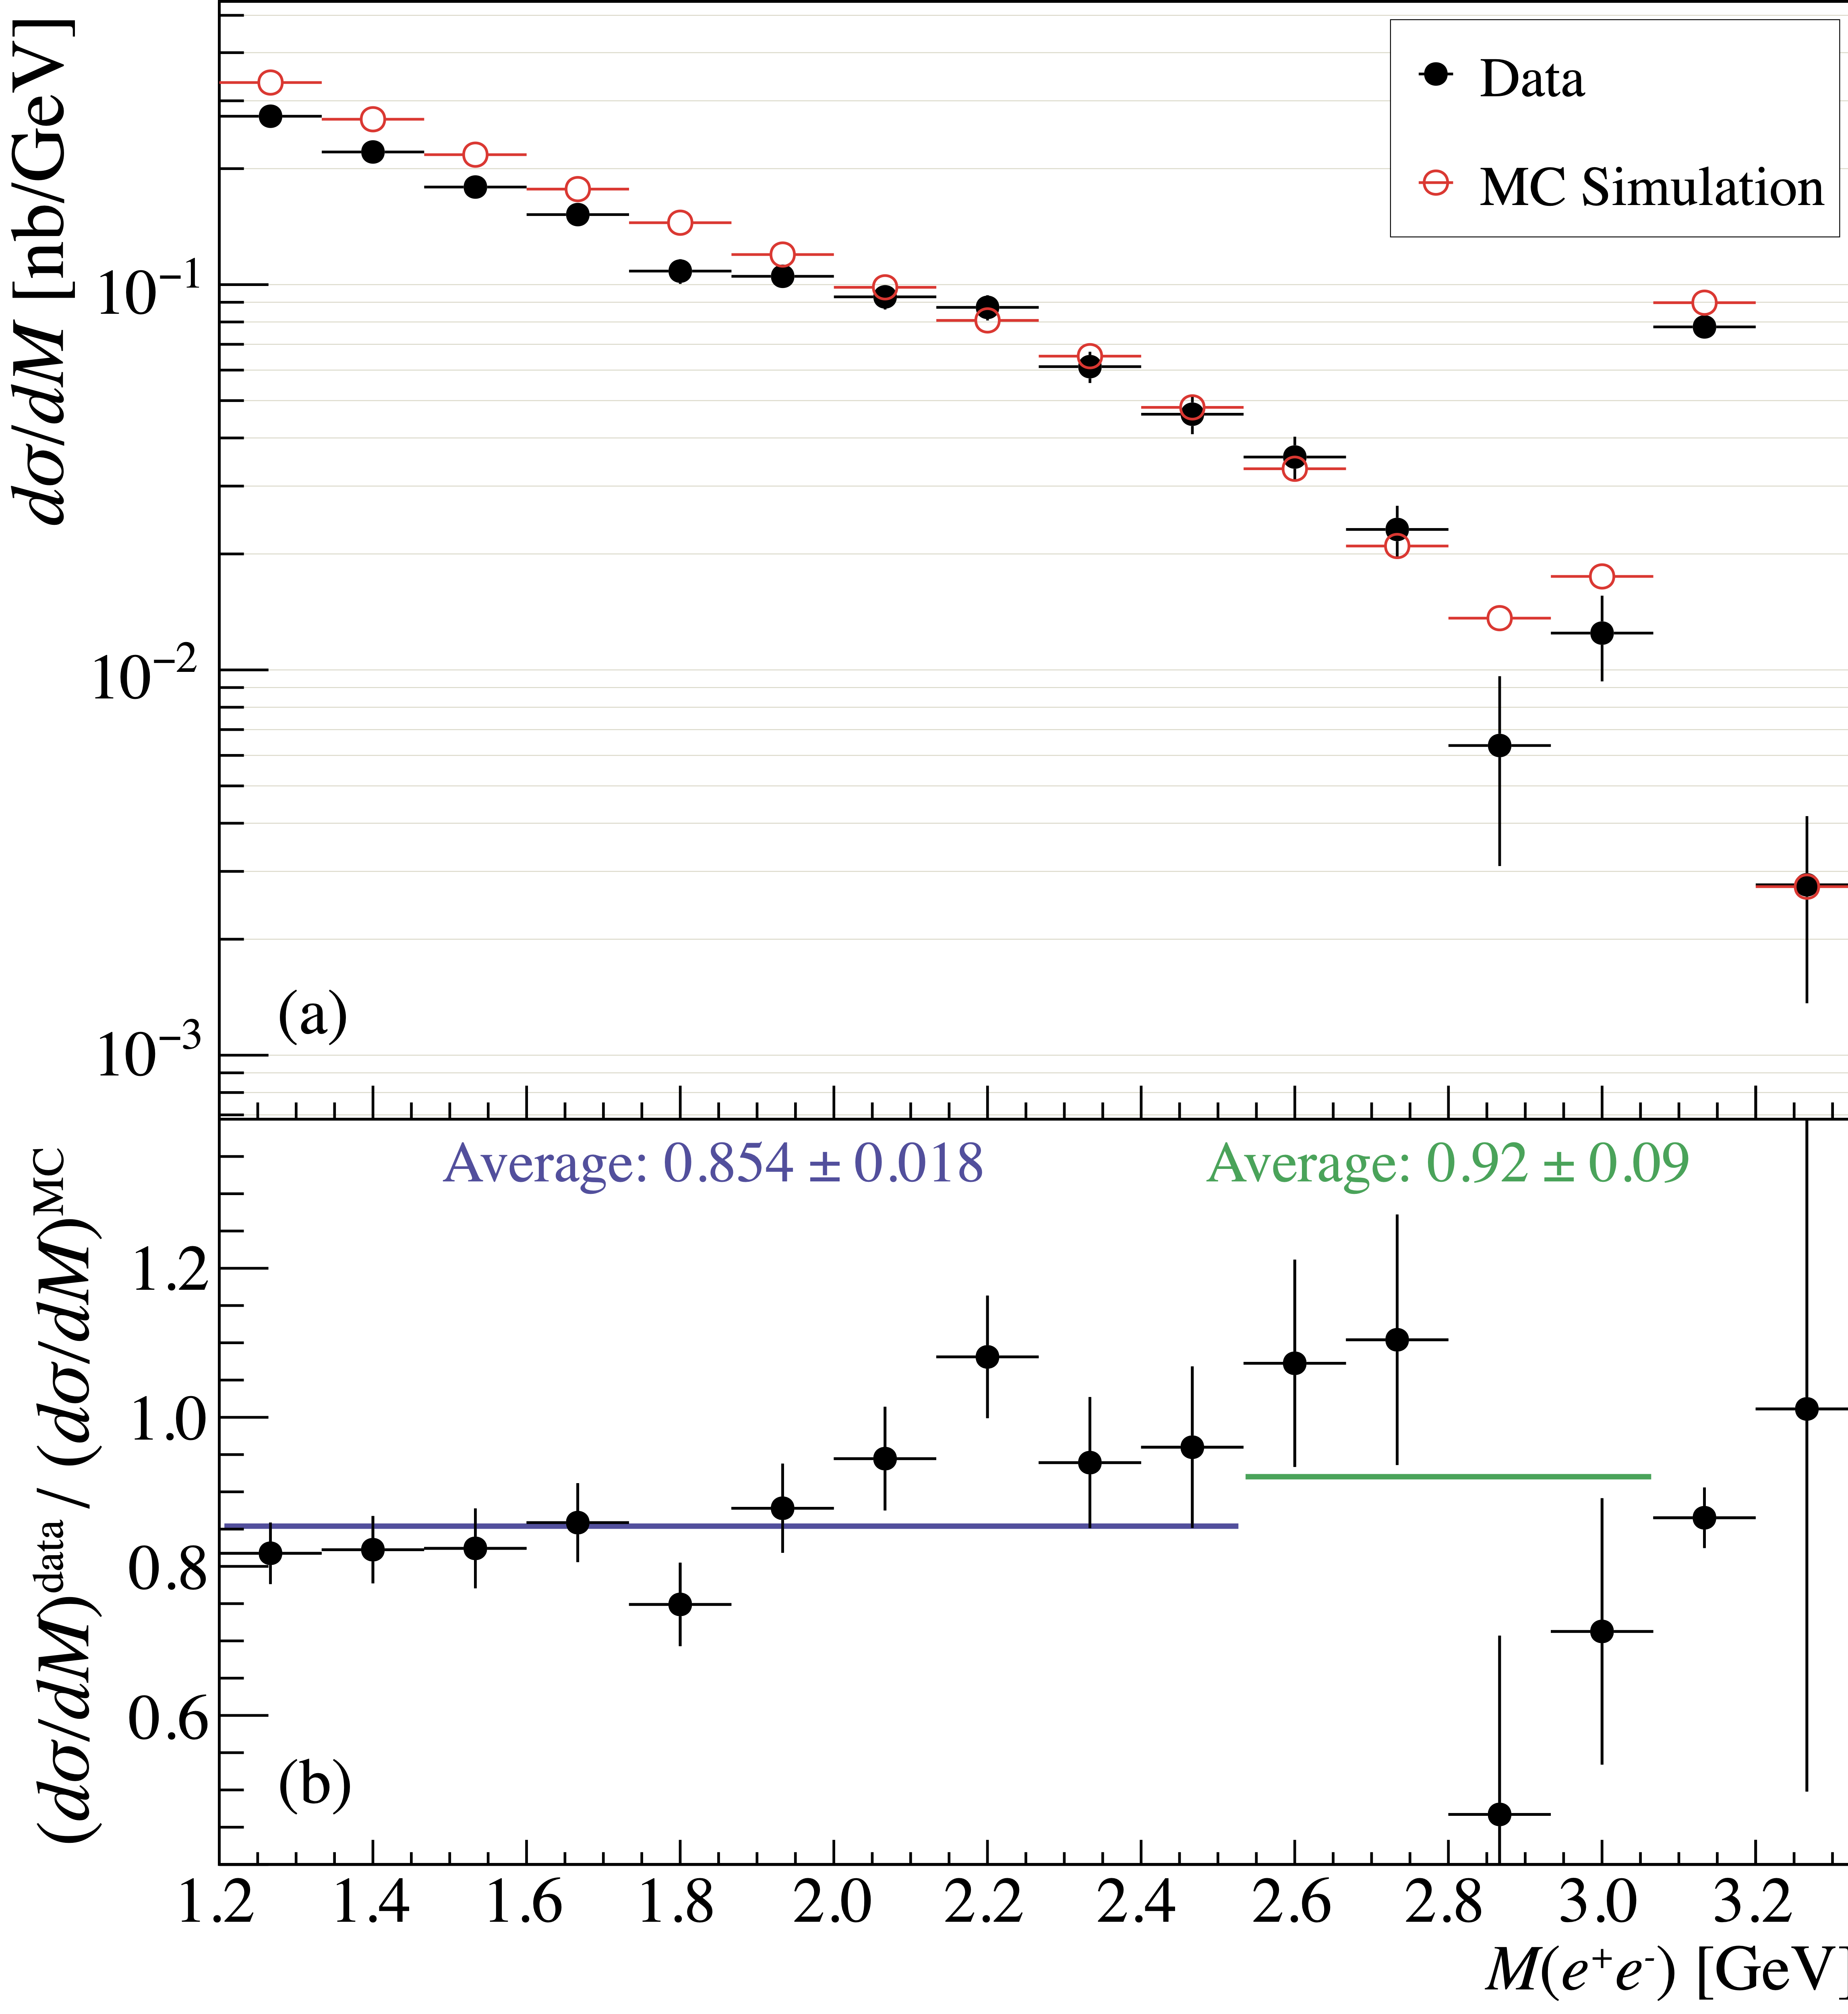
Figure 6:
The sum of BH and $J/\psi$ cross sections as function of $e^+e^-$ invariant mass. (a) Cross section obtained from data and MC simulation. (b) Ratio of data and MC cross sections from (a) fitted with constants in two regions, the region used for normalization of the $J/\psi$ cross section, and the vicinity of the $J/\psi $ peak. |
Phys. Rev. C108, 025201 (2023): downloads png pdf |
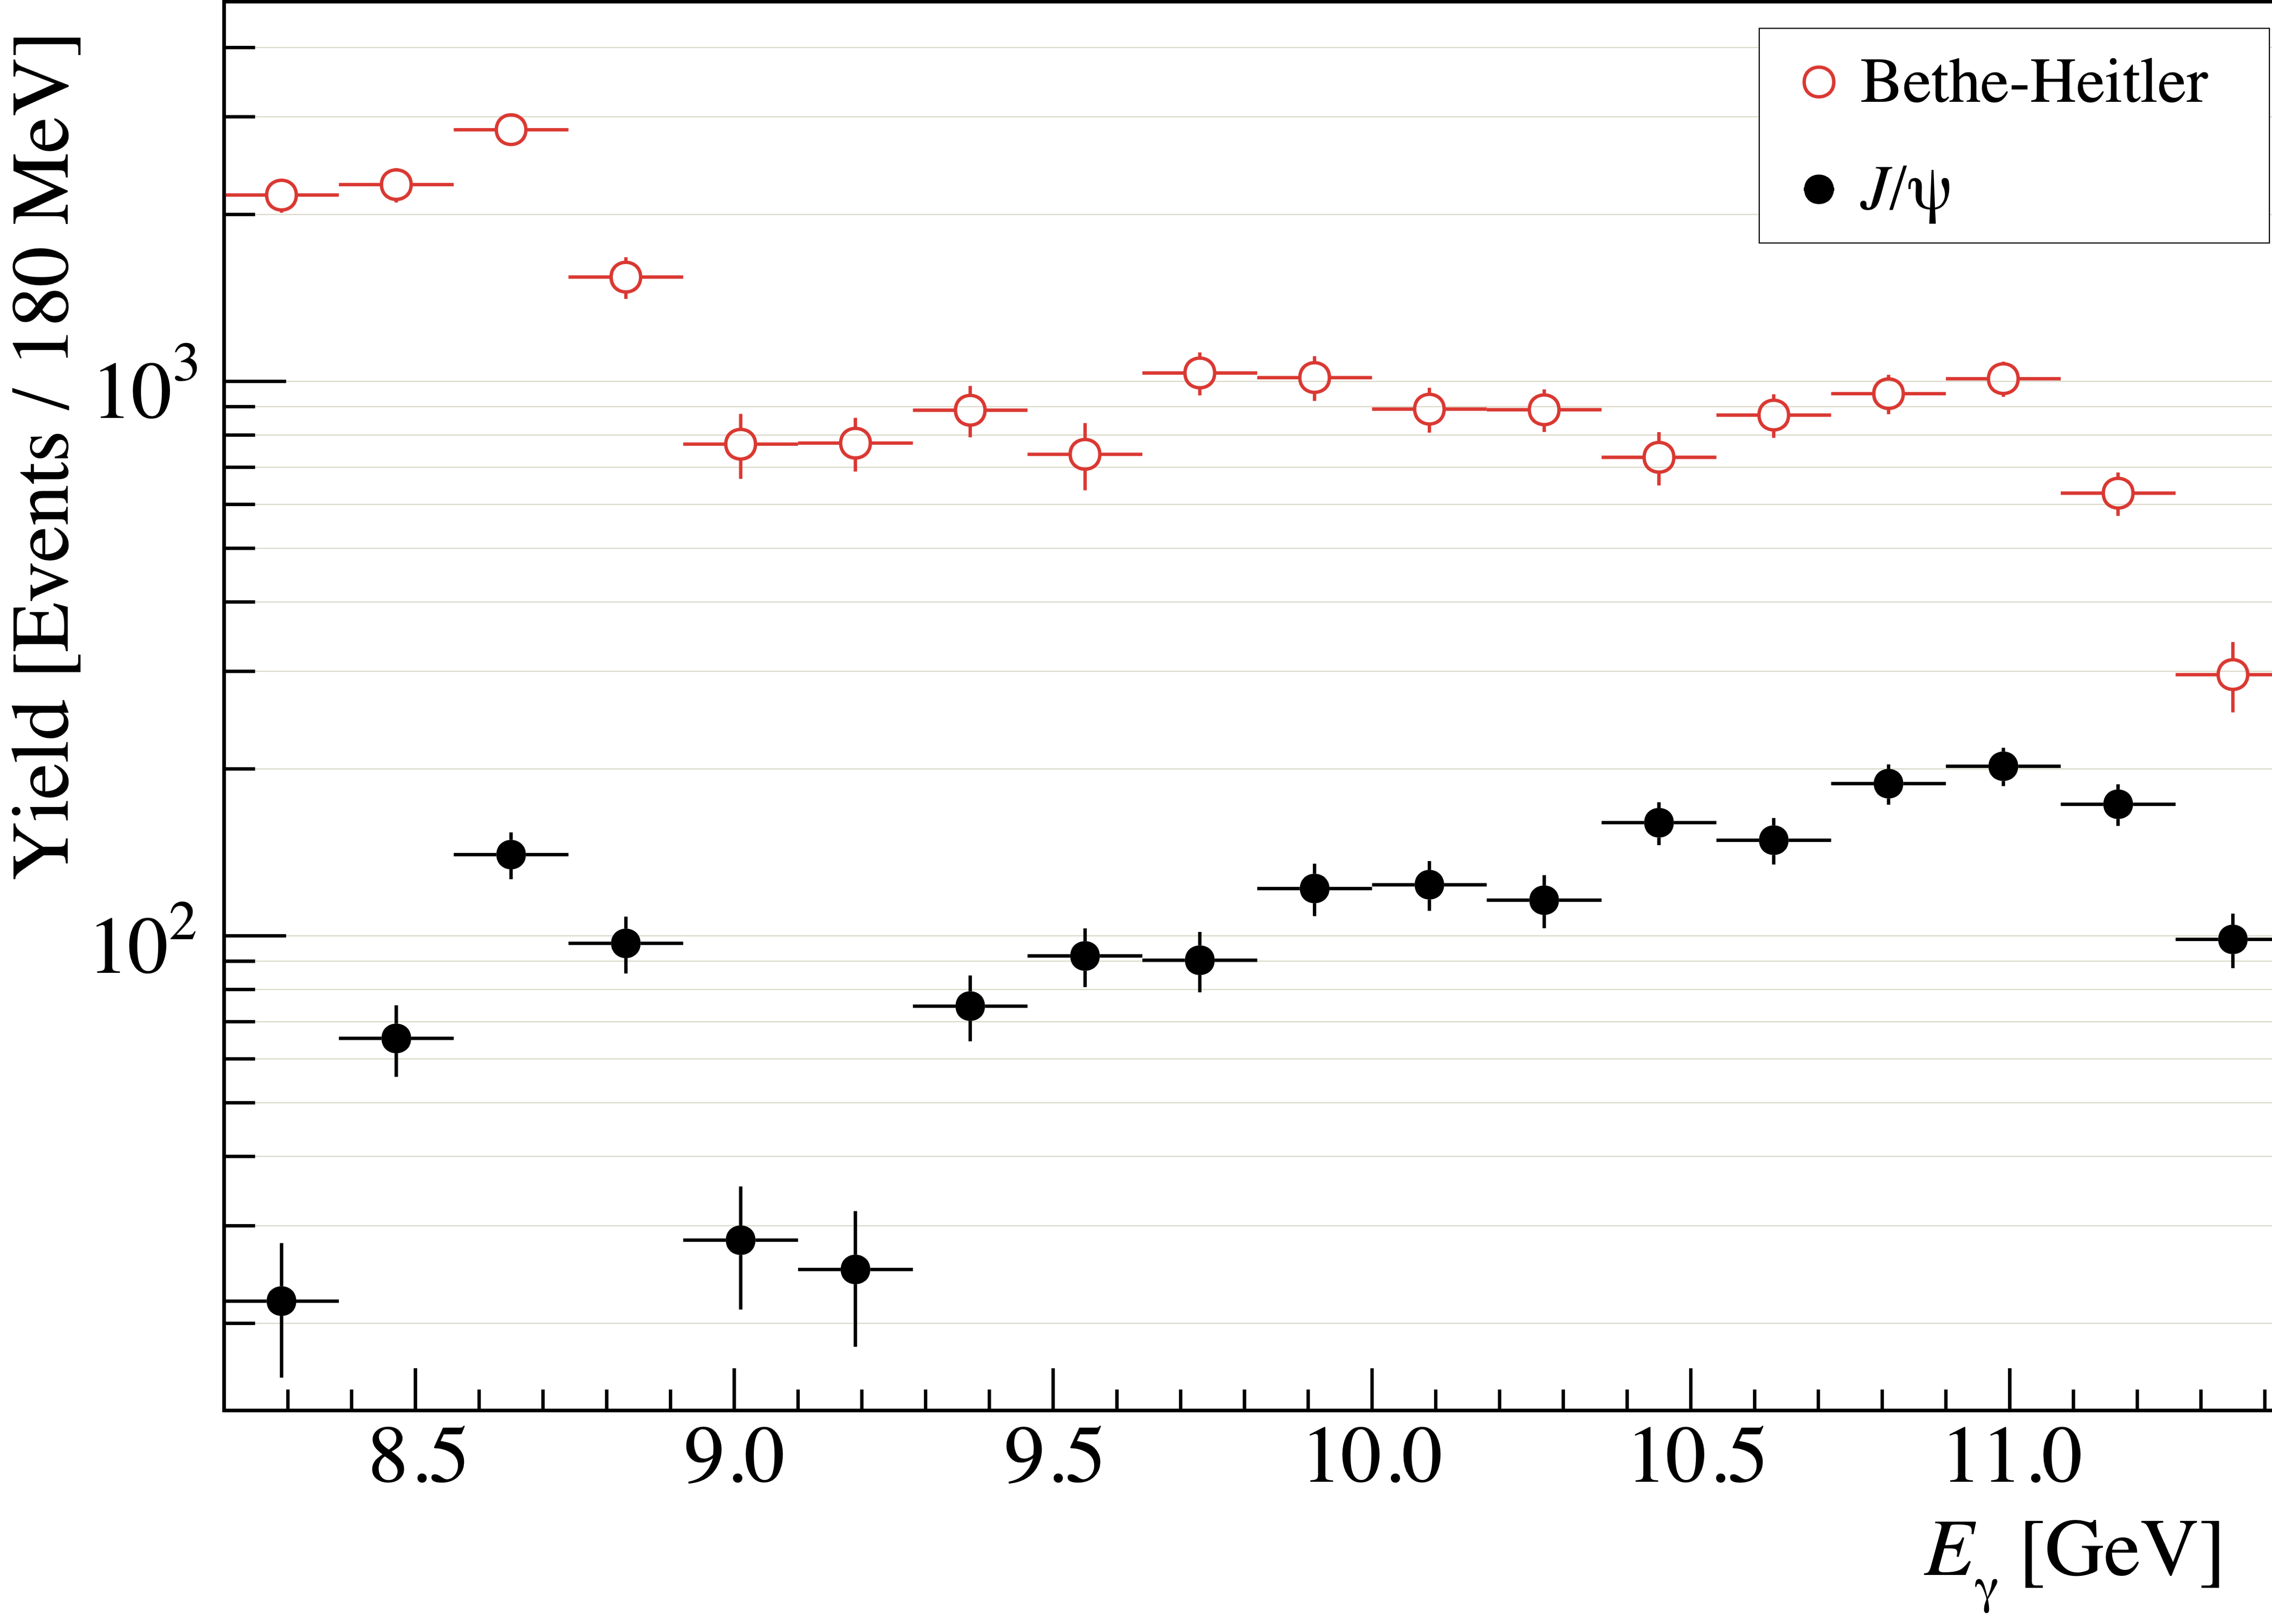
Figure 7:
Comparison of BH and $J/\psi $ yields as function of beam energy. |
Phys. Rev. C108, 025201 (2023): downloads png pdf |
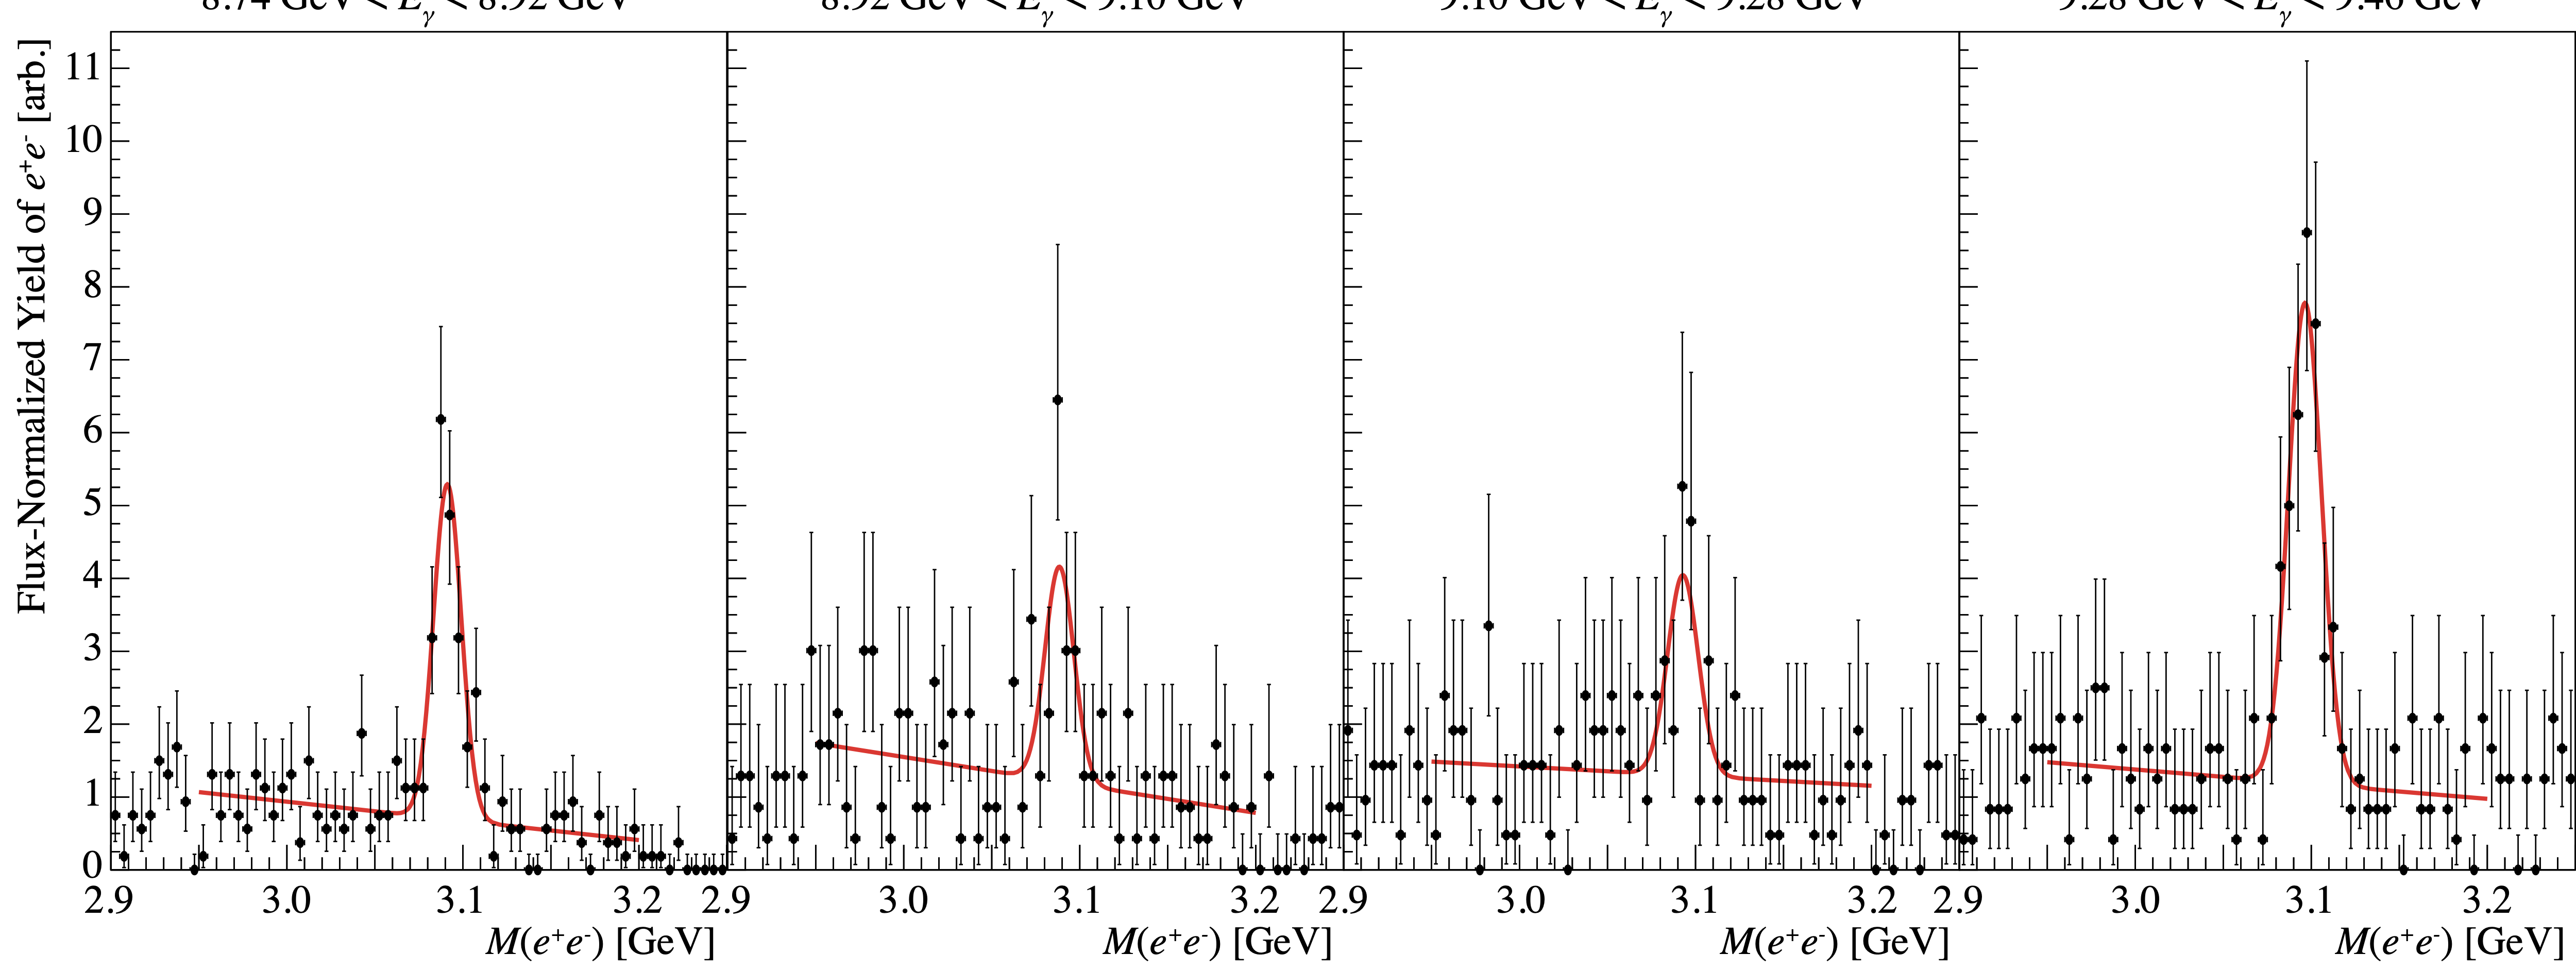
Figure 8:
Distribution of $M(e^+e^-)$ in bins of beam energy $E_\gamma$ with fits to the $J/\psi$ peak overlaid. The $y$ axis of each histogram is scaled by the flux integrated over the corresponding $E_\gamma$ bin. |
Phys. Rev. C108, 025201 (2023): downloads png pdf |
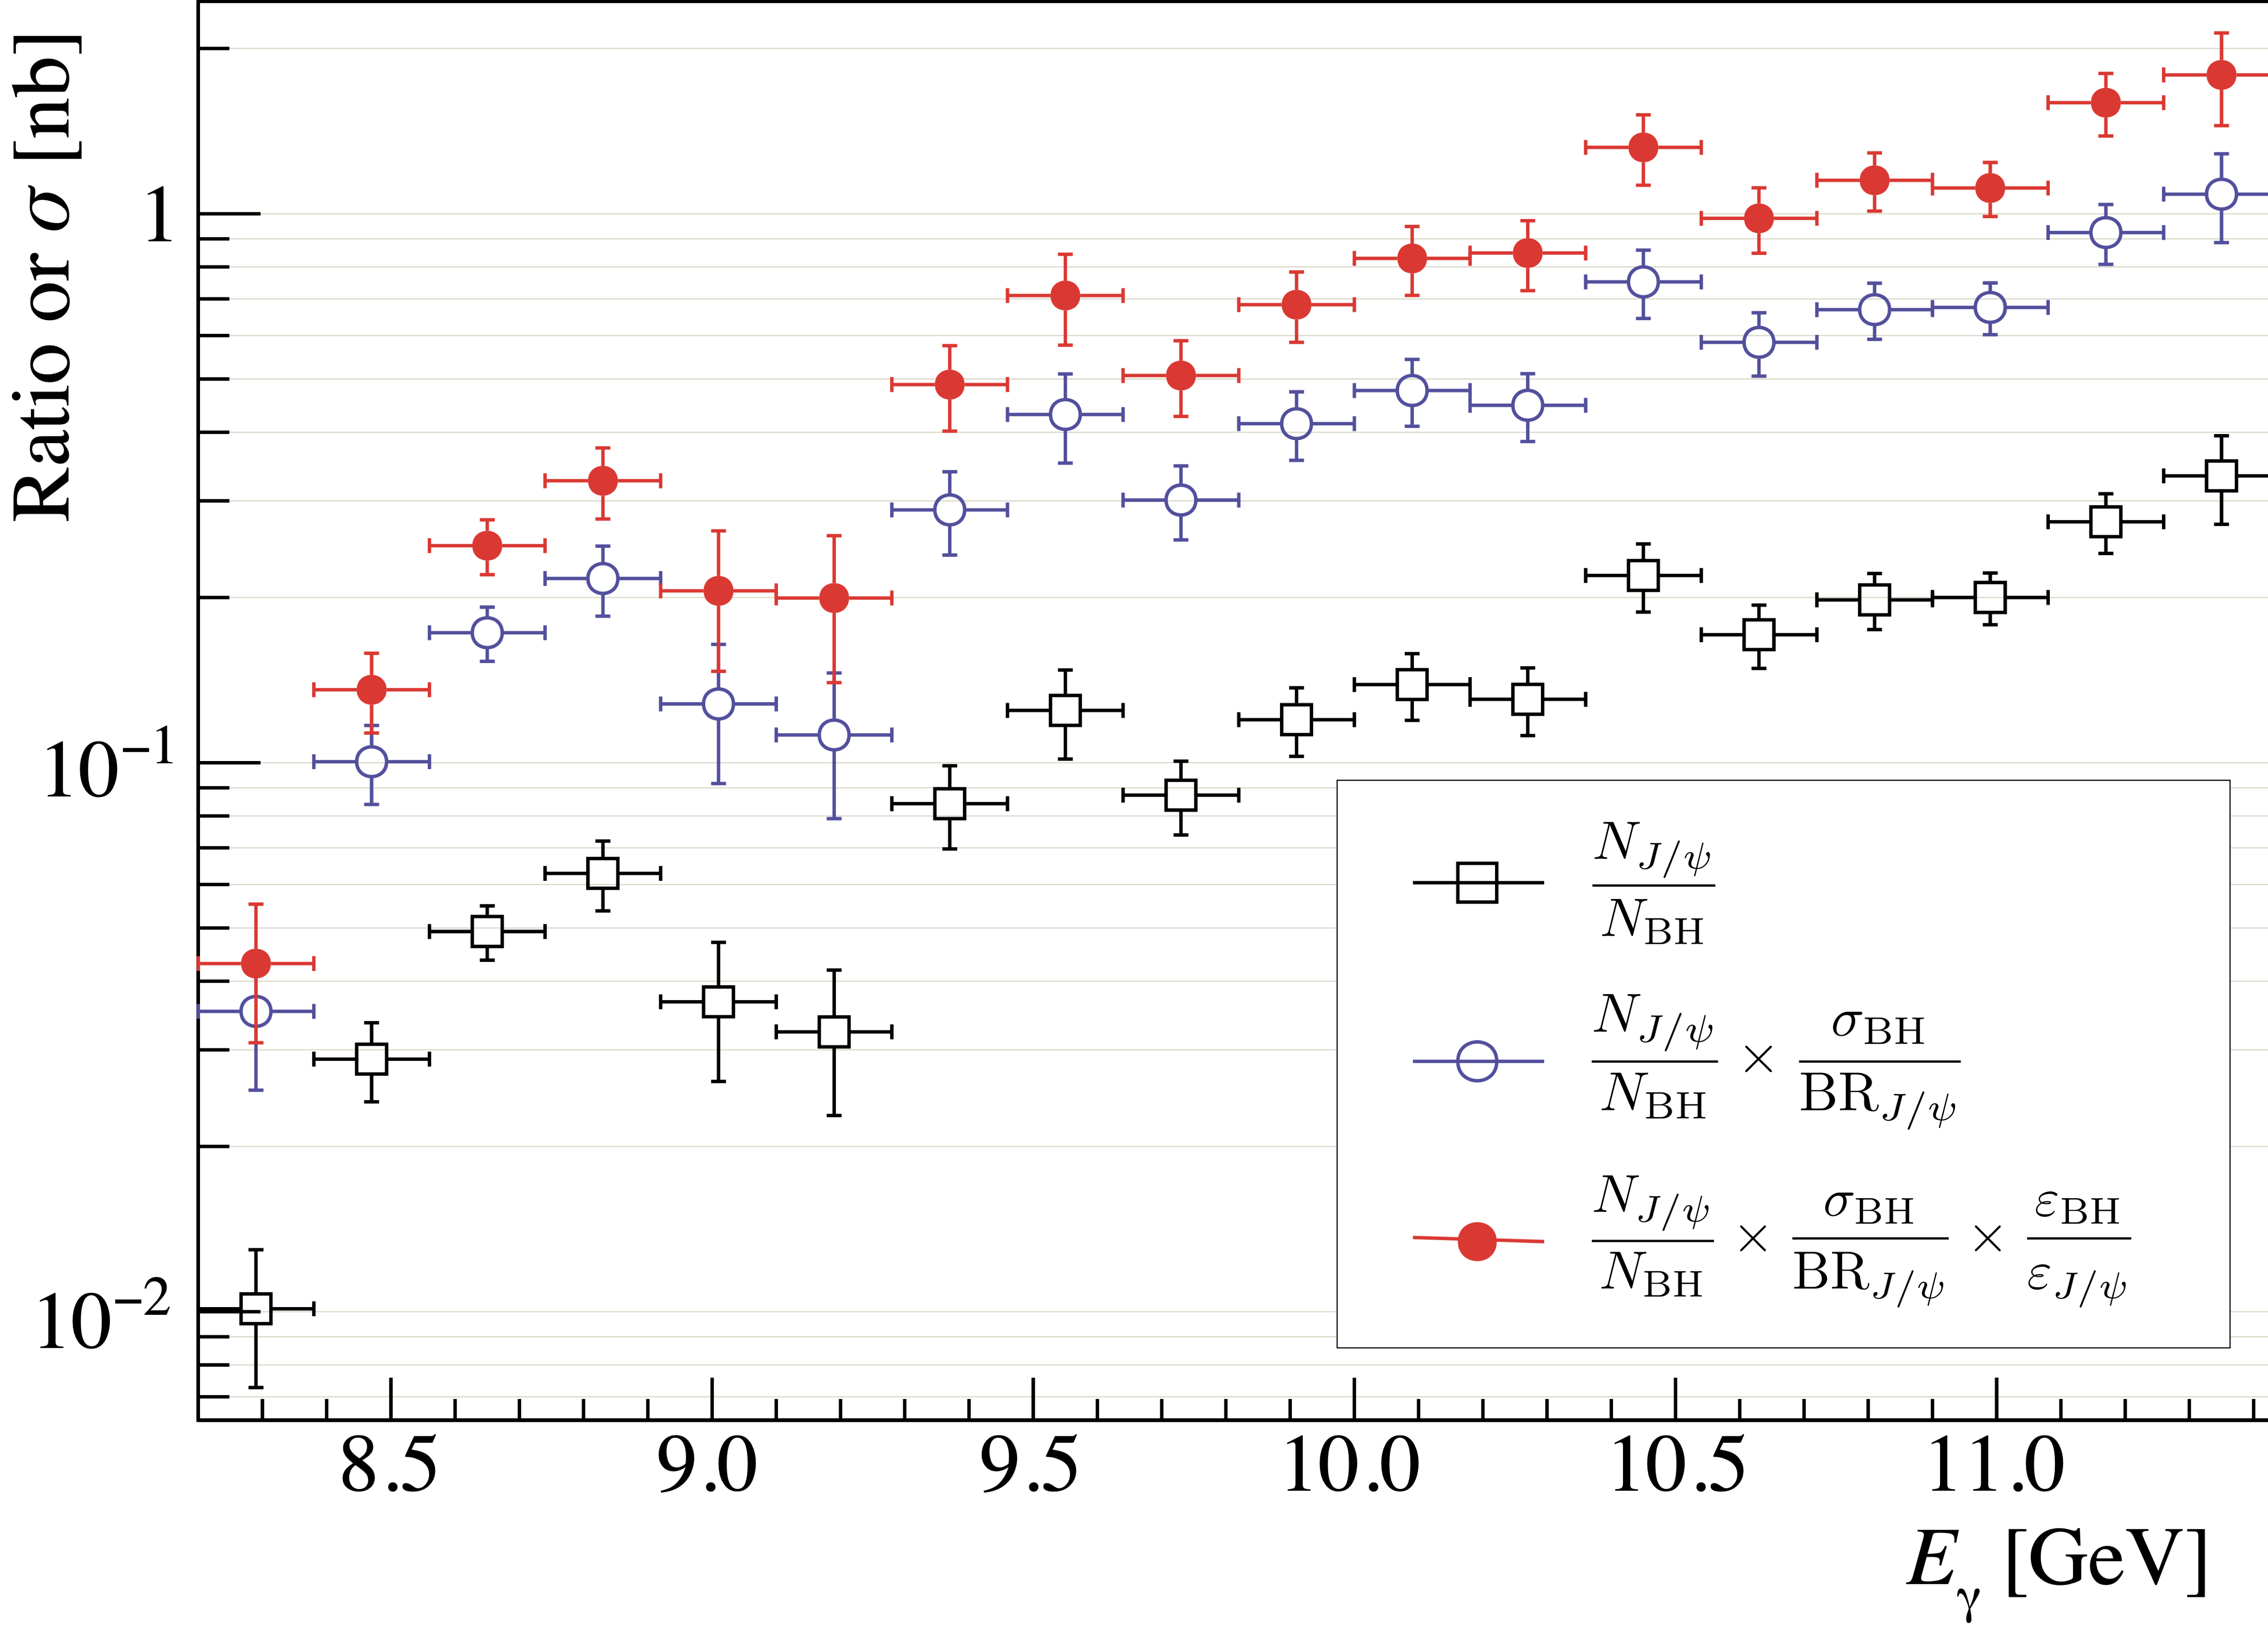
Figure 9:
Intermediate results of the $J/\psi $ cross-section calculation, the $J/\psi $ to BH yield ratio (black open squares); the yield ratio multiplied by the BH cross section over $BR(J/\psi \to e^+e^-)$ (blue open points); and this result further corrected by the BH-to-$J/\psi $ efficiency ratio (solid red points) corresponding to the final cross section (See Eq.(3)). The nb units are valid for the final result only (solid red points). Only the statistical errors are shown. |
Phys. Rev. C108, 025201 (2023): downloads png pdf |
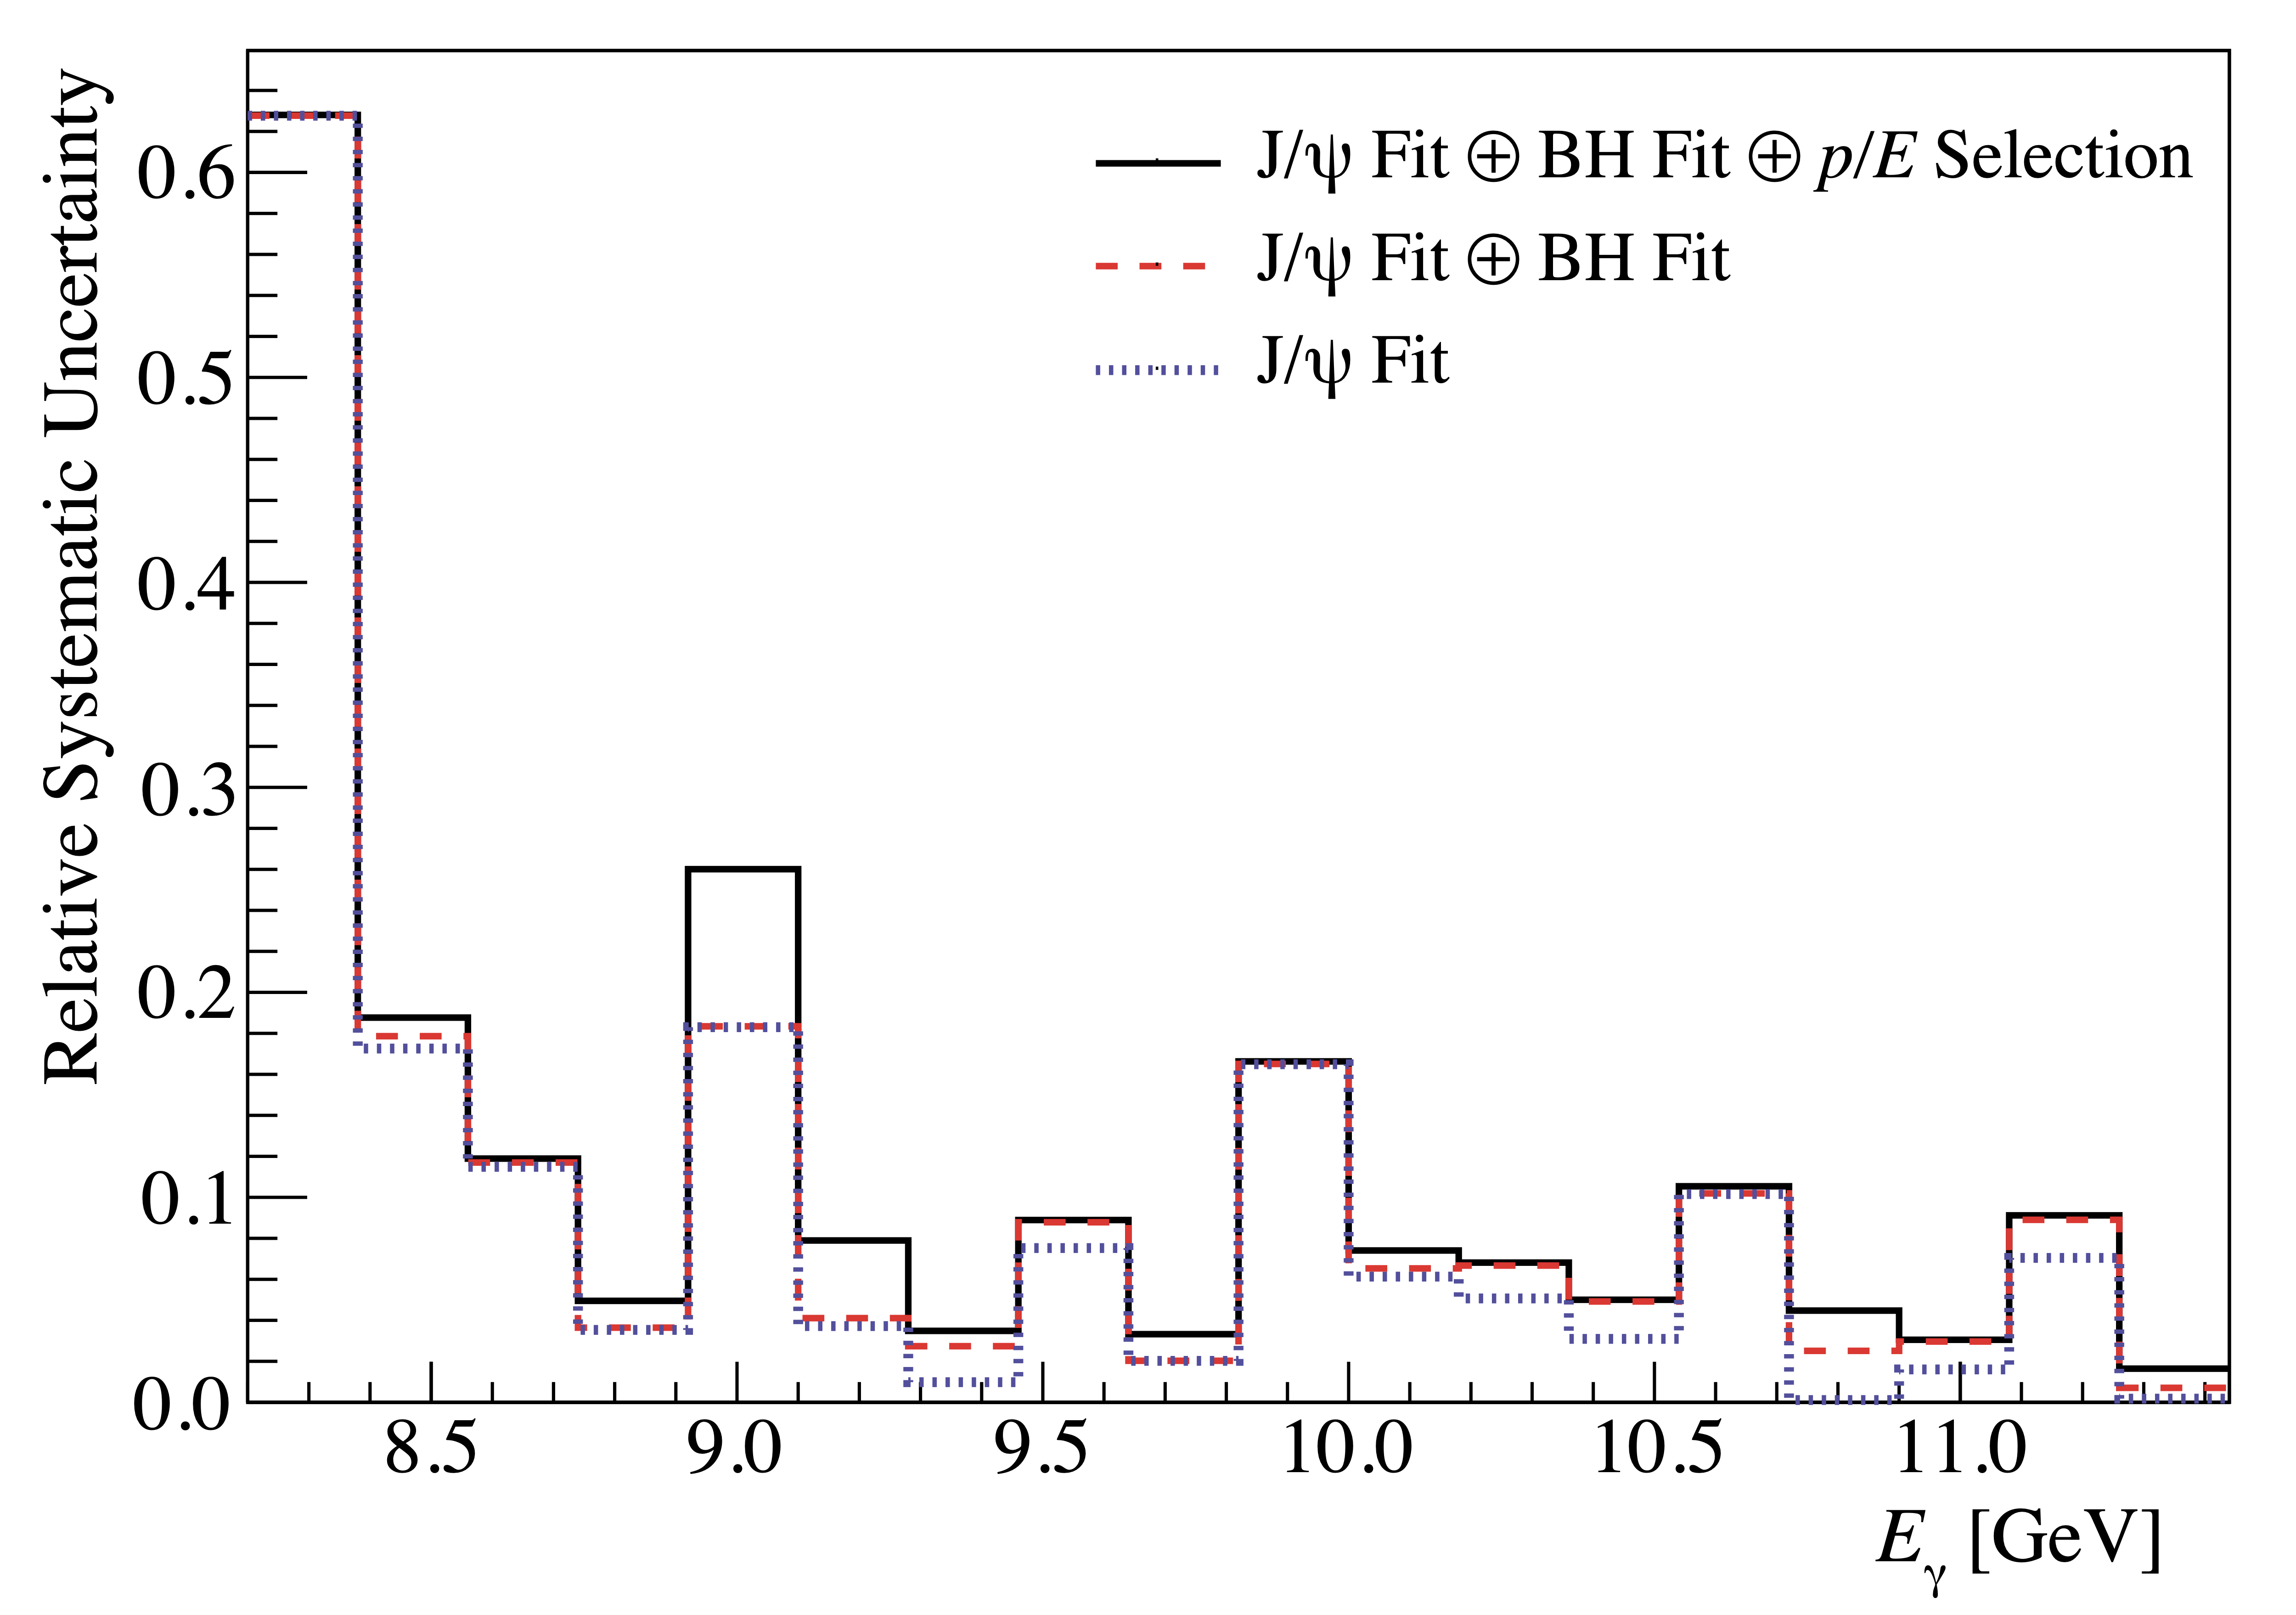
Figure 10:
Contributions of the different sources to the systematic uncertainties of the individual energy bins, successively added in quadrature. |
Phys. Rev. C108, 025201 (2023): downloads png pdf |
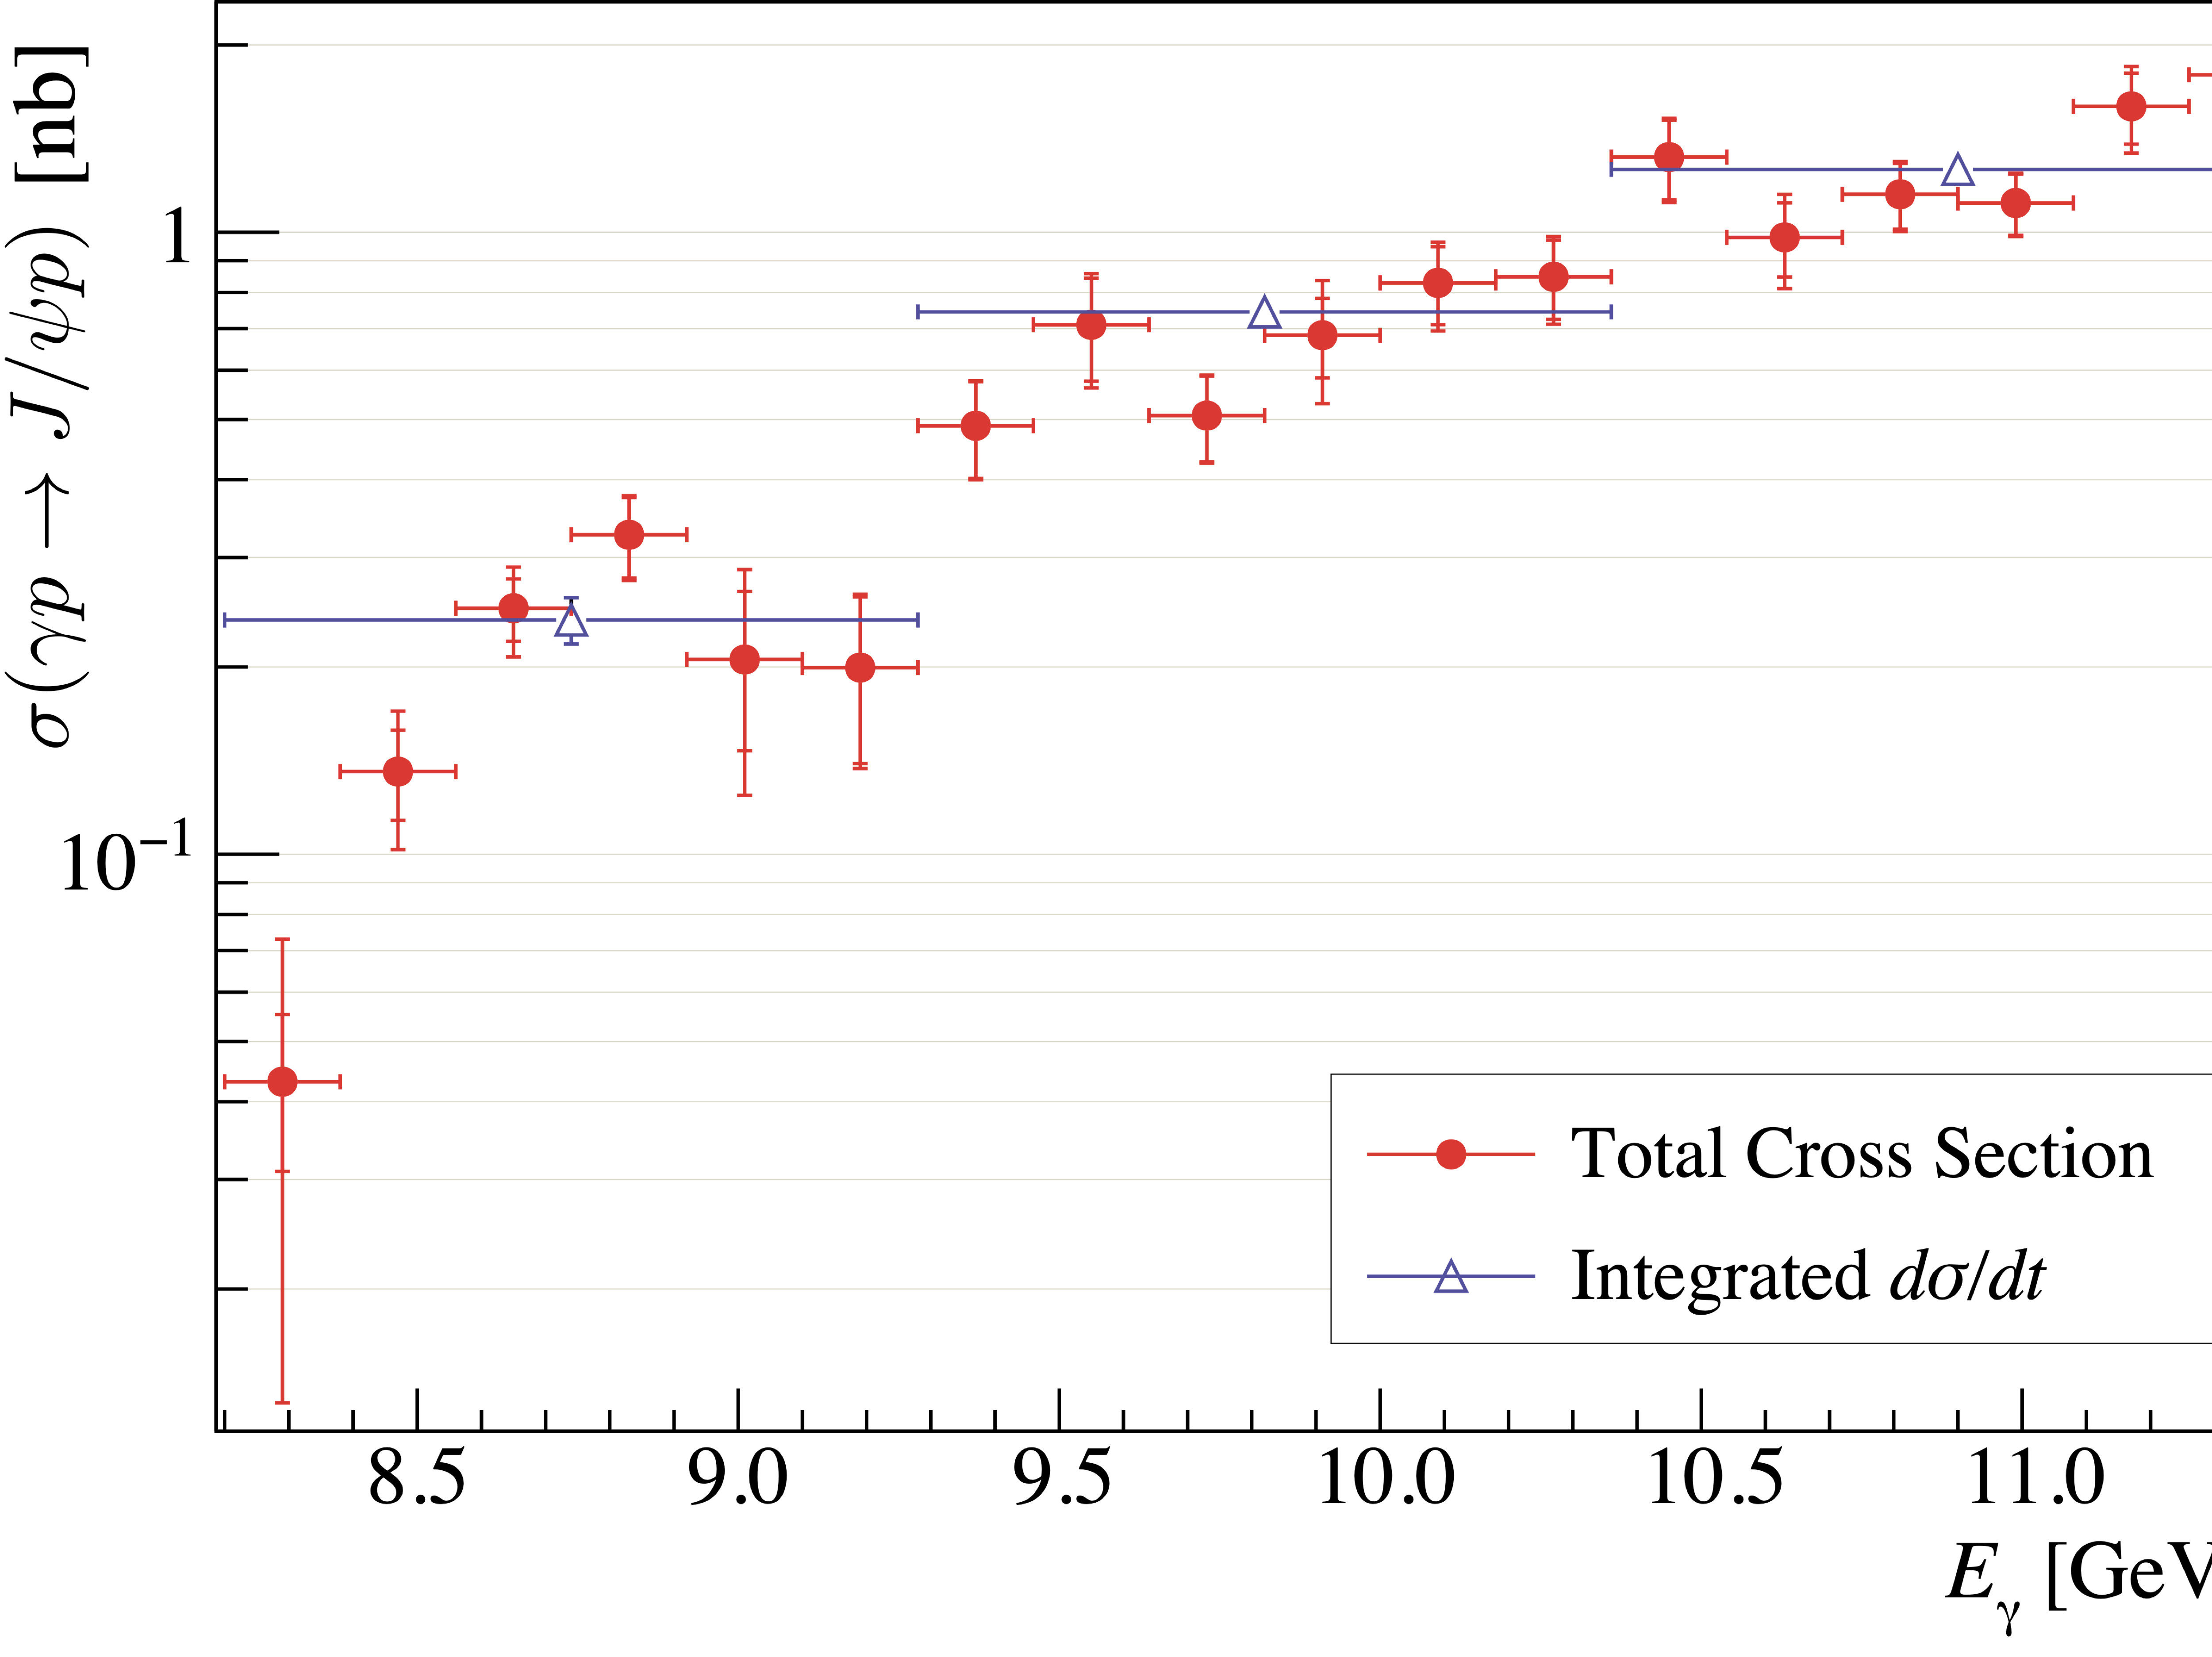
Figure 11:
The filled red points show the measured total cross sections obtained from Eq.(3) in fine photon energy bins. The inner bars represent the statistical errors and outer bars are the total errors, with the statistical and systematic errors added in quadrature. The open blue triangles represent the total cross sections calculated by integrating the functions fitted to the measured differential cross sections for the three beam energy regions, with only the statistical uncertainties shown. |
Phys. Rev. C108, 025201 (2023): downloads png pdf |
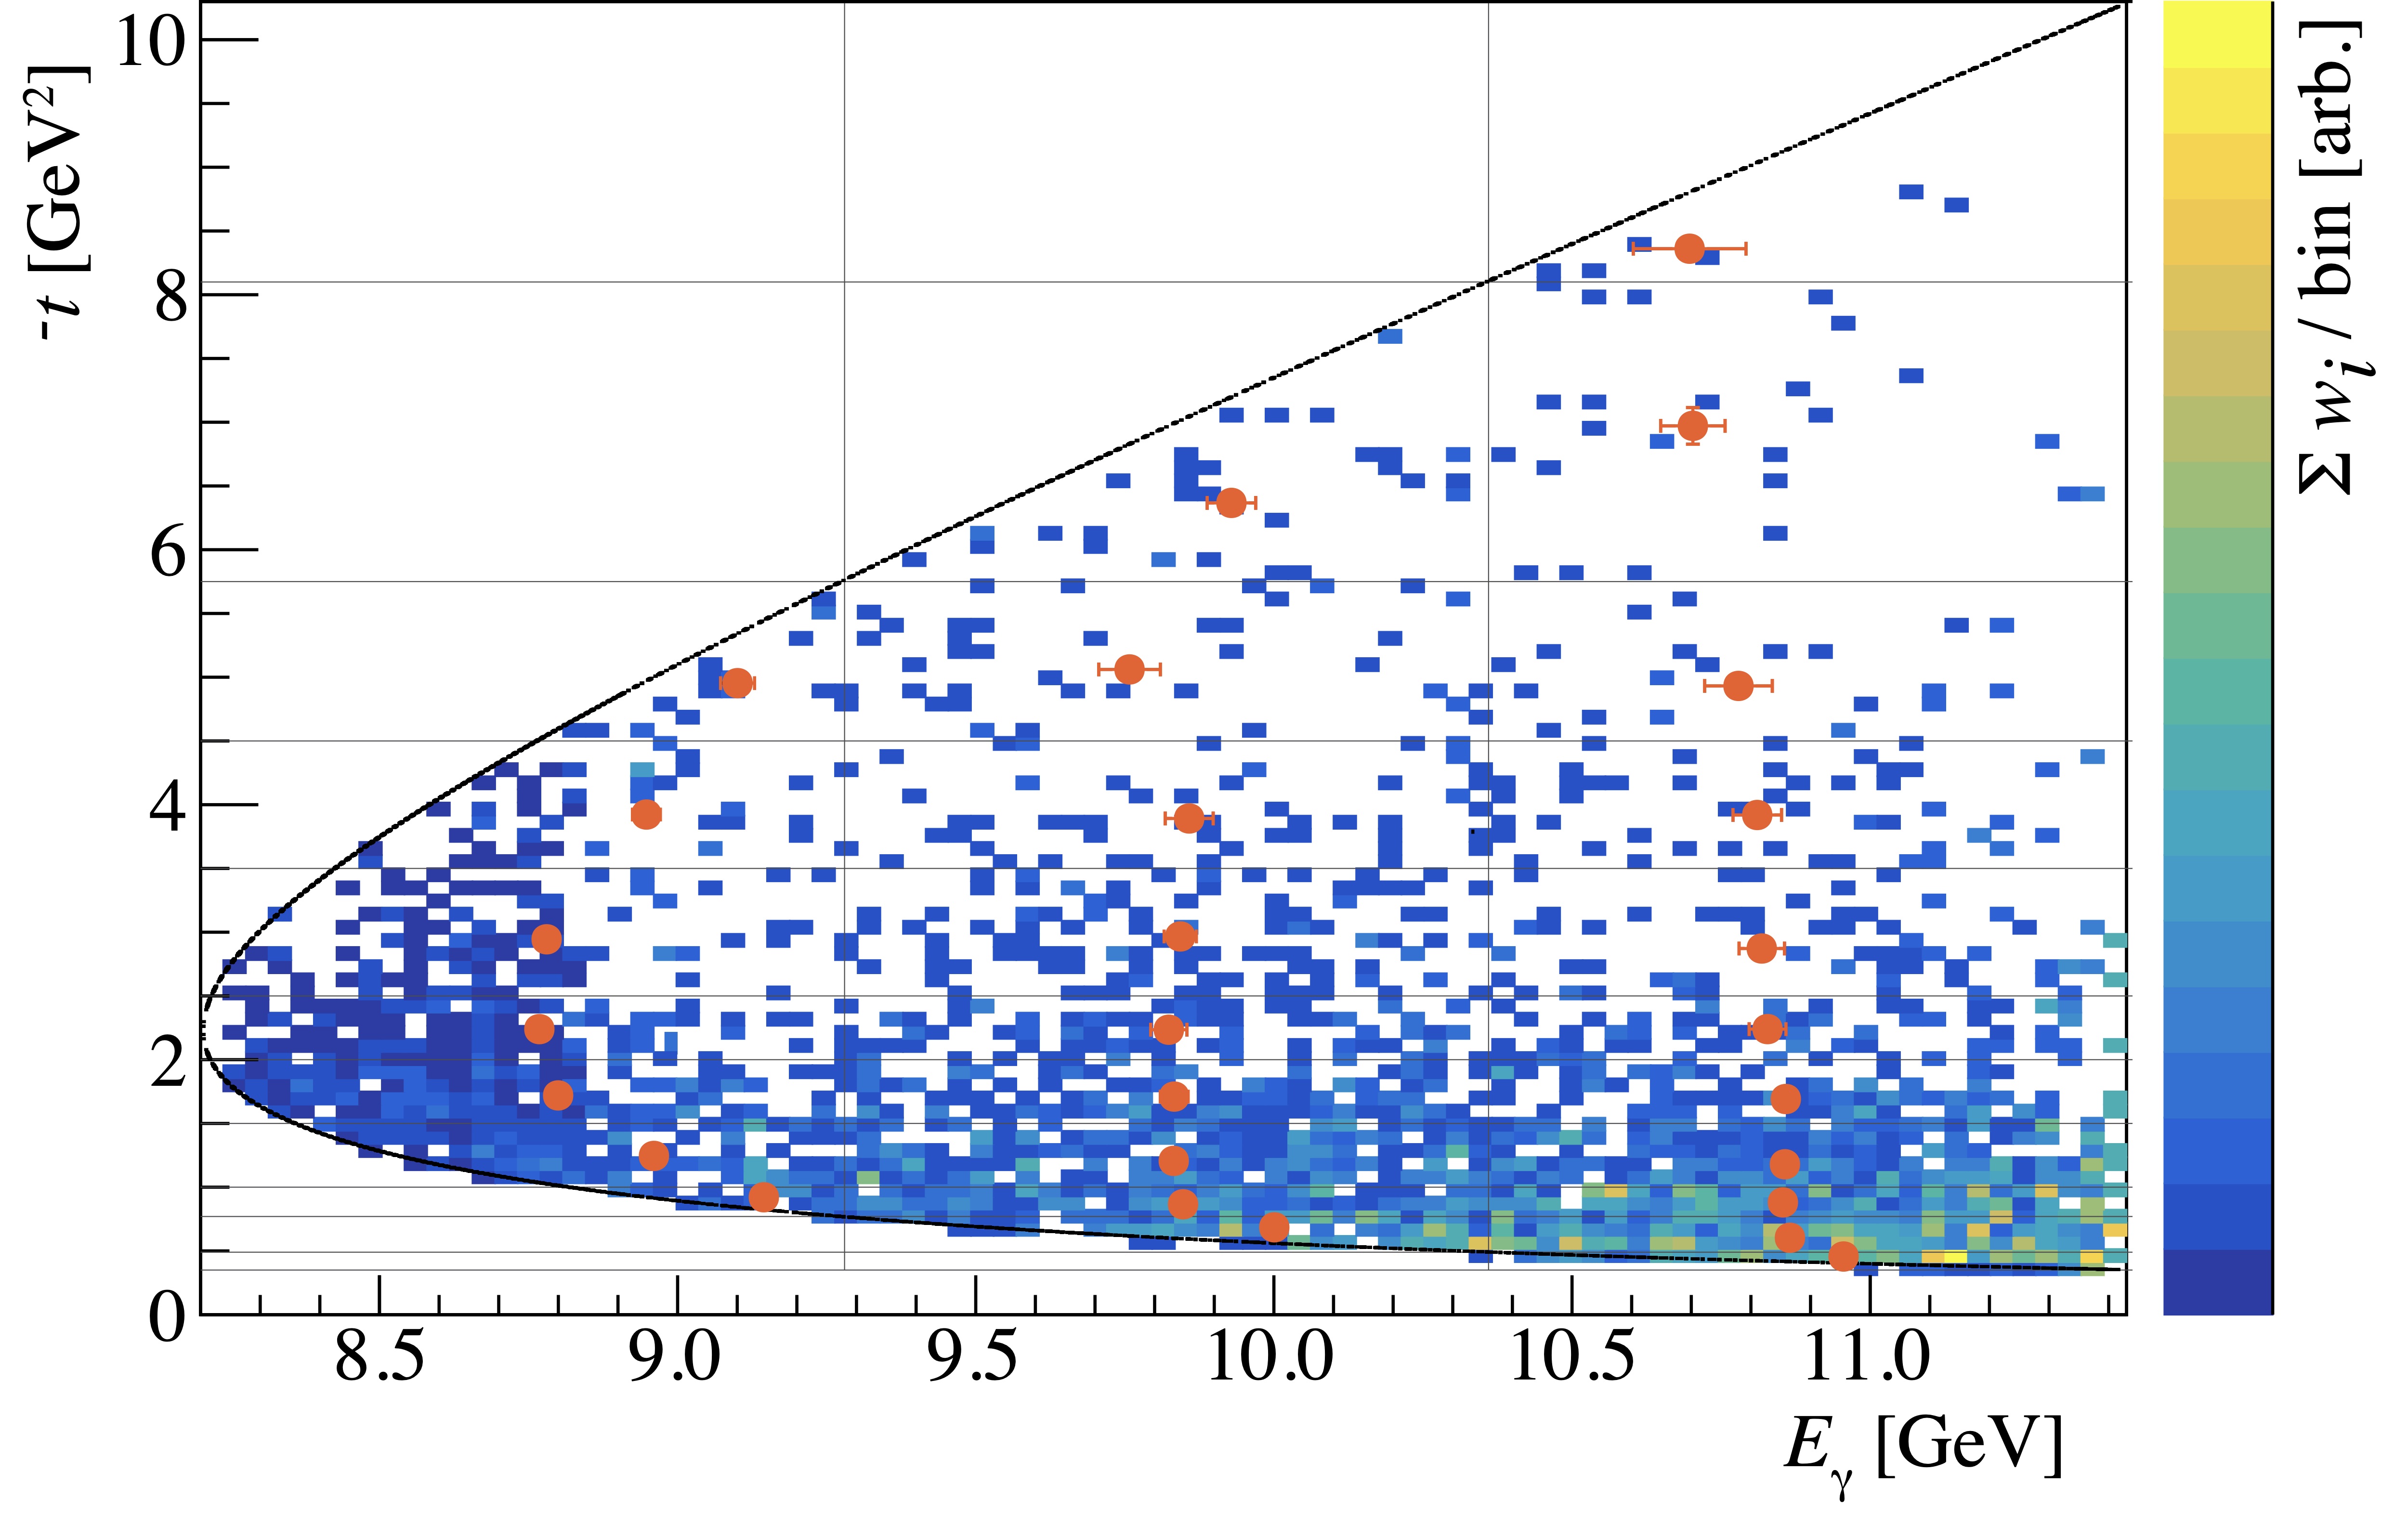
Figure 12:
The distribution of the flux-weighted data in the $E_\gamma-t$ plane and the mean values of the reported cross sections (solid dots) within the corresponding bins. A mass selection of $3.05 < M(e^{+}e^{-}) < 3.15$ GeV is used for the events in this plot. |
Phys. Rev. C108, 025201 (2023): downloads png pdf |
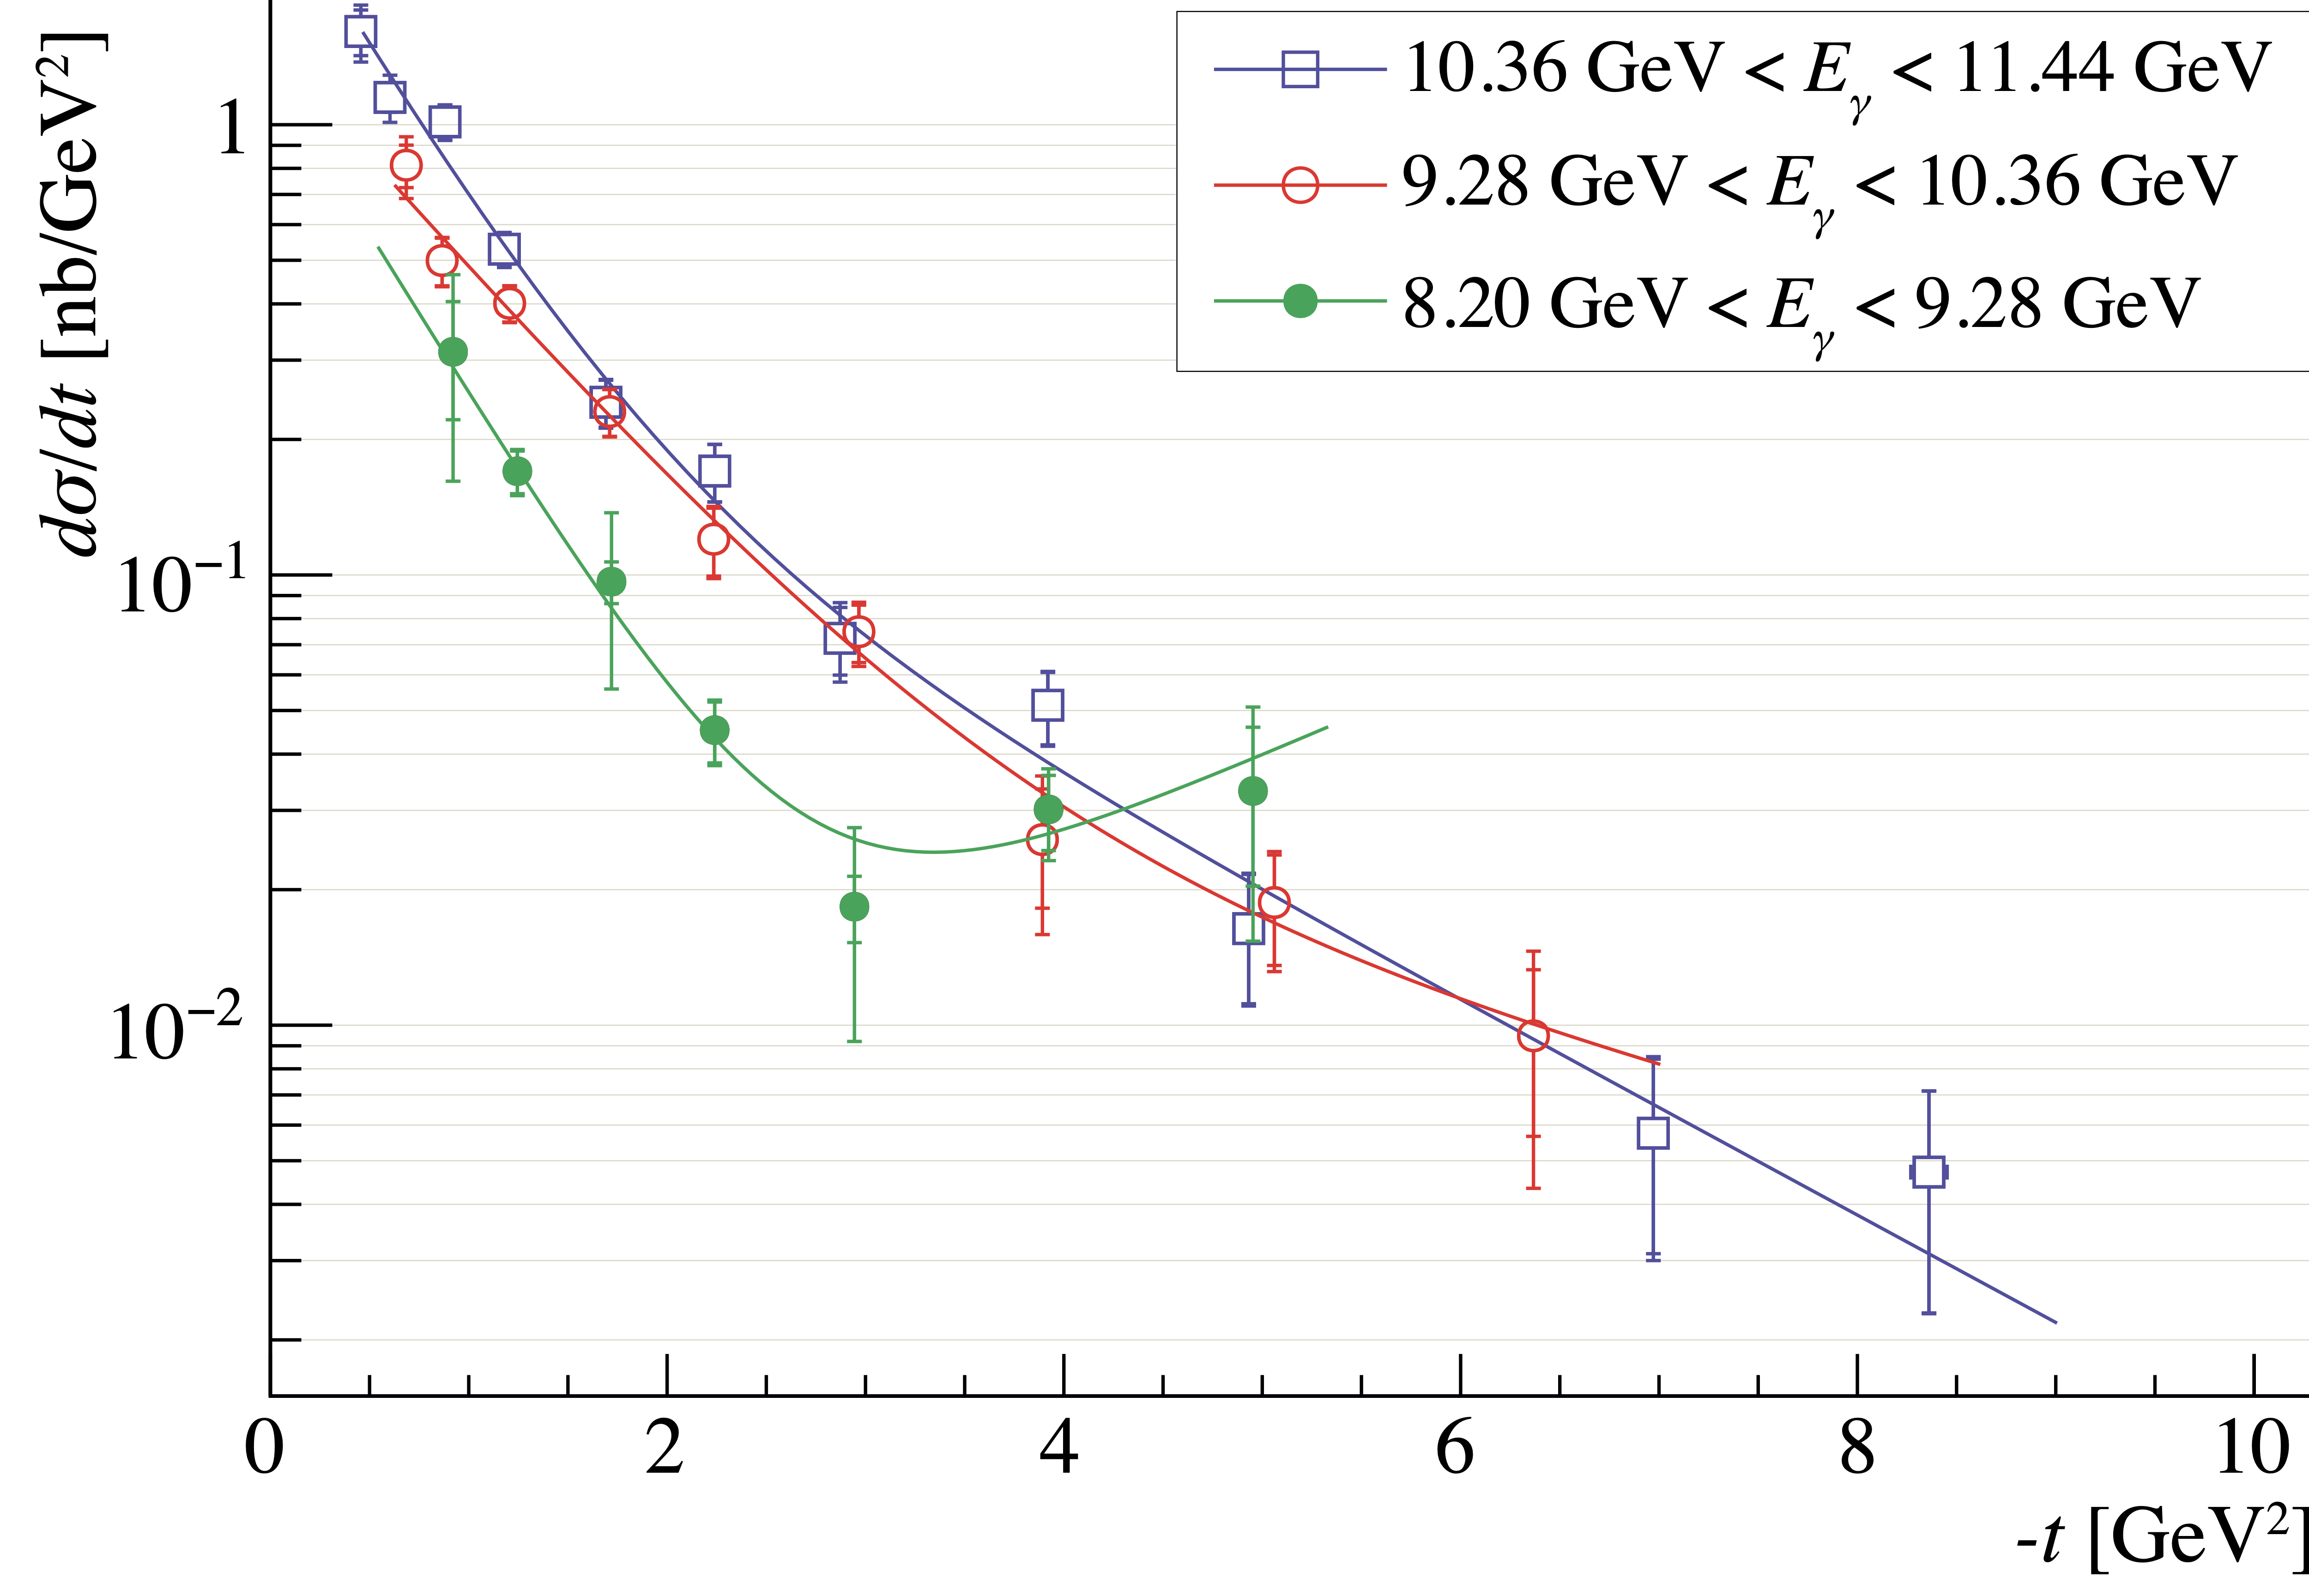
Figure 13:
The measured differential cross sections with both statistical (inner bars) and total (outer bars) uncertainties shown for the three energy regions, from Eq. (5). The points are fitted with a sum of two exponential functions. The second exponential contribution is most significant in the lowest energy bin, where the slope changes sign. |
Phys. Rev. C108, 025201 (2023): downloads png pdf |
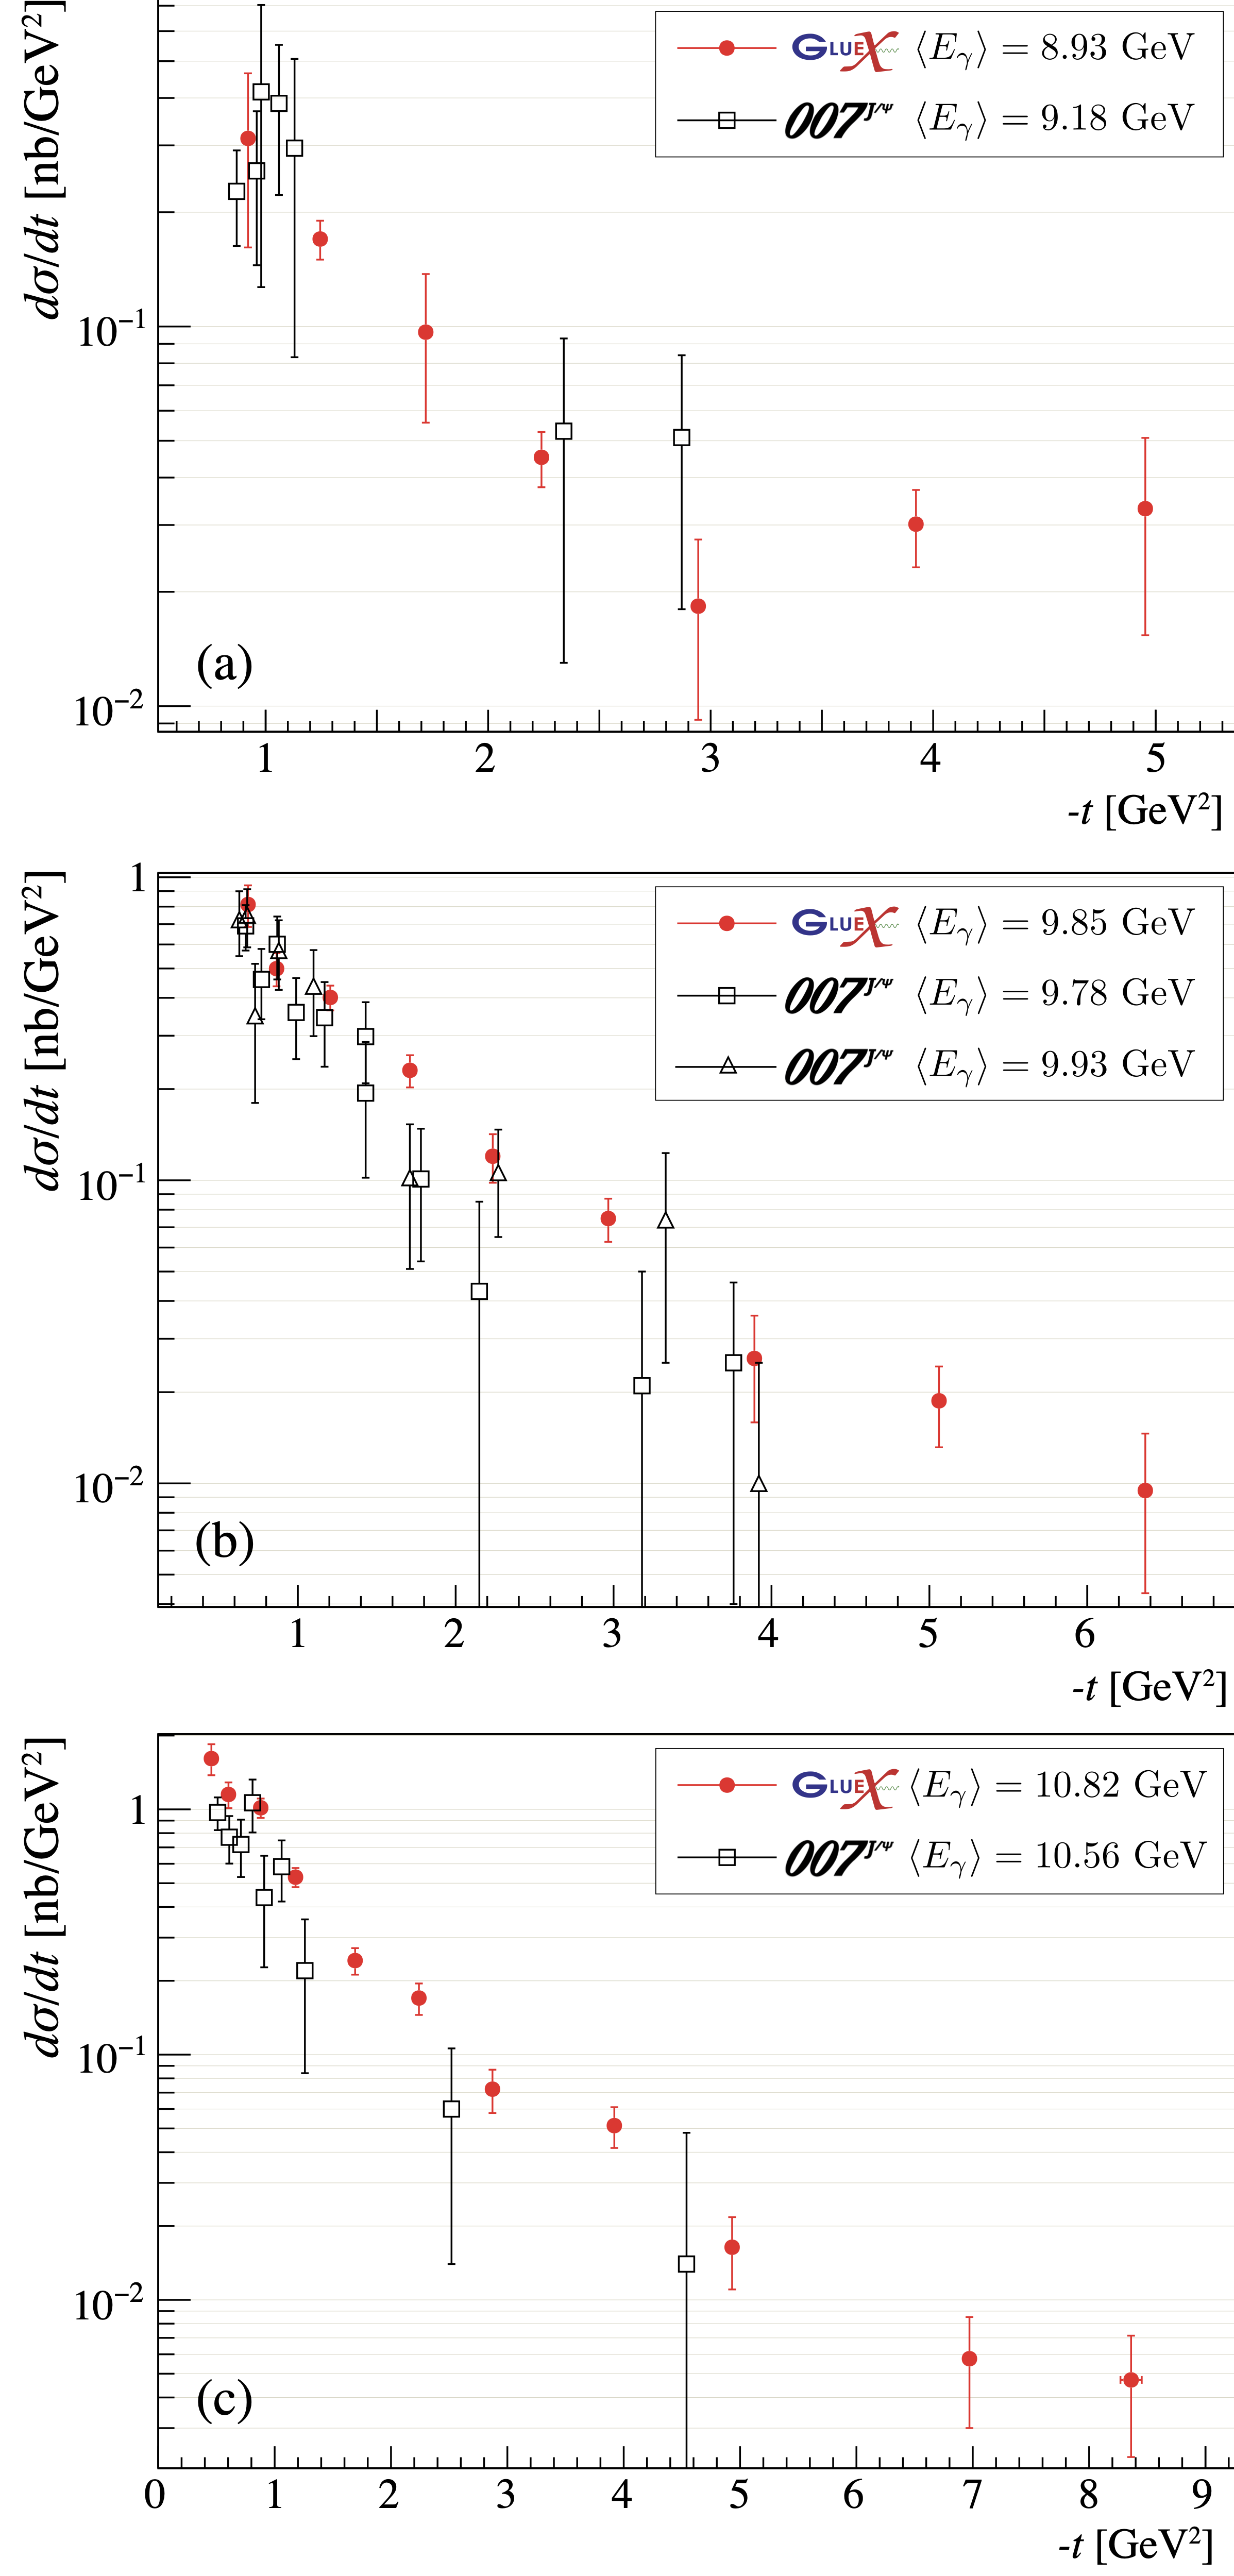
Figure 14:
Comparison of the differential cross sections for the three energy regions from this work to the measurements of the $J/\psi-007$ experiment closest in energy [41]. |
Phys. Rev. C108, 025201 (2023): downloads png pdf |
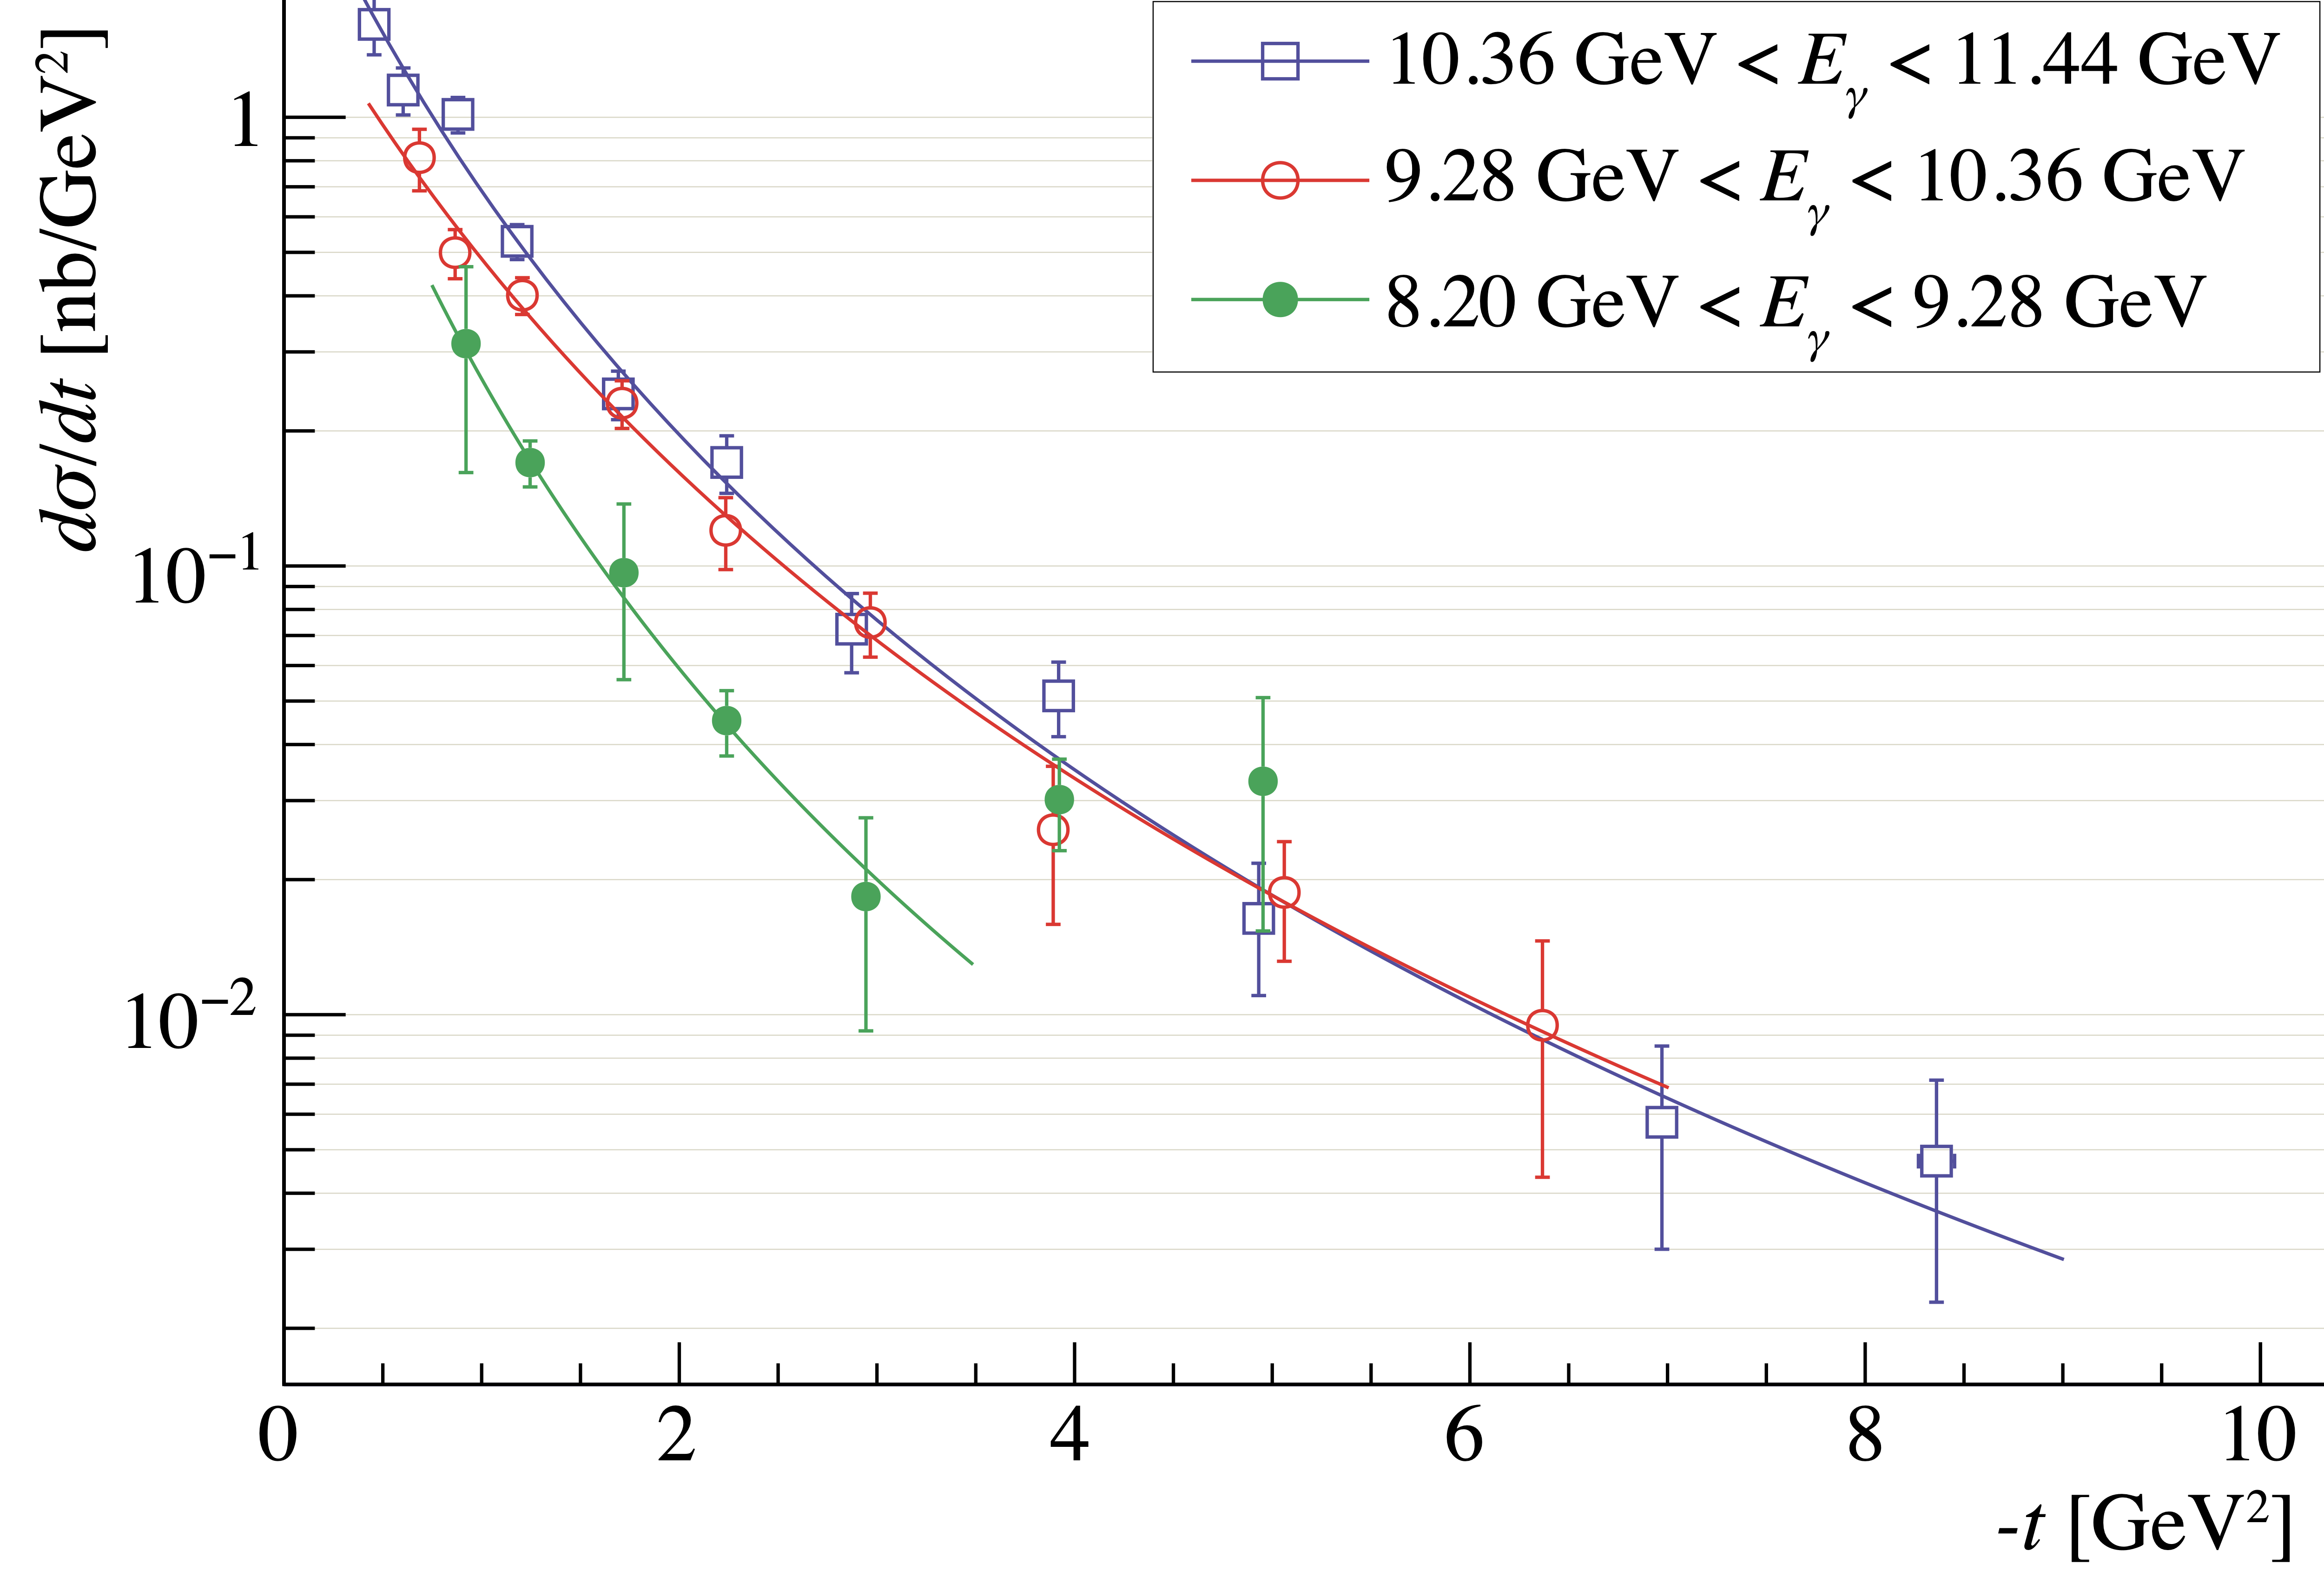
Figure 15:
The differential cross sections for the three energy regions fitted with $[d\sigma/dt(0)]/(1-t/m_s^2)^4$, where the cross section at $t=0$, $d\sigma/dt(0)$, and the mass scale, $m_s$, are free parameters. |
Phys. Rev. C108, 025201 (2023): downloads png pdf |
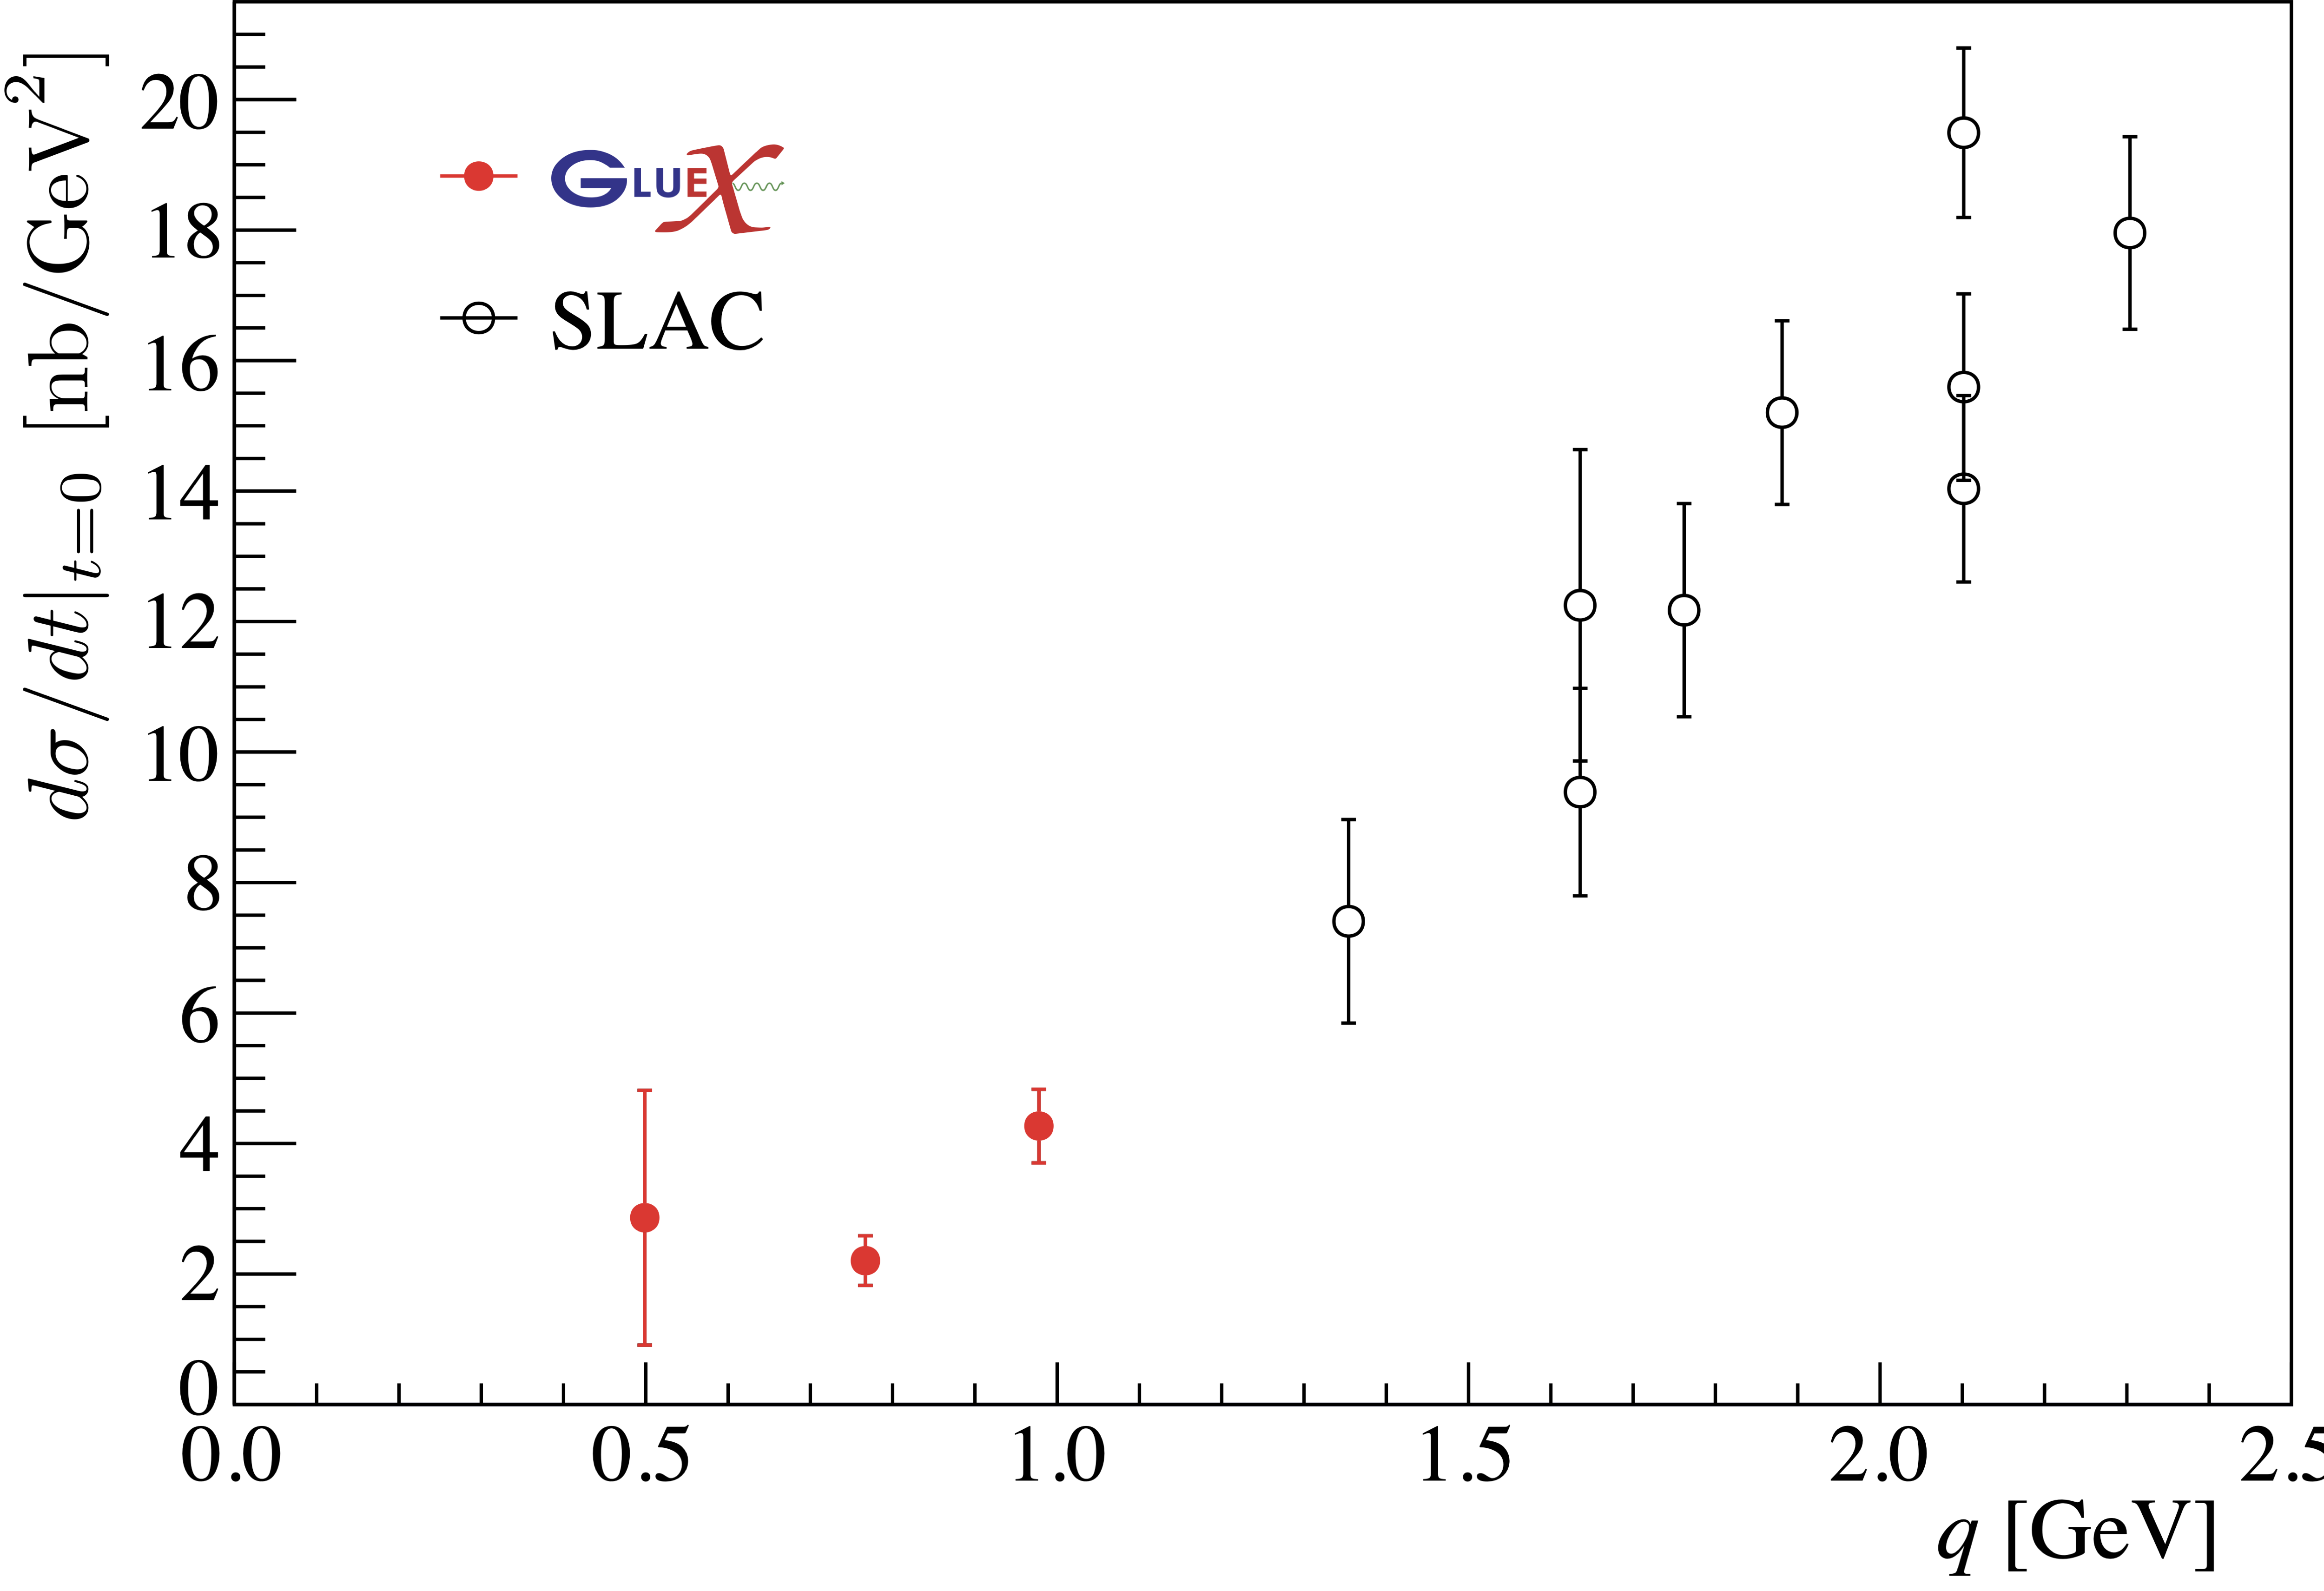
Figure 16:
The forward ($t=0$) differential cross section as a function of final particle center-of-mass momentum from this work (filled red points) and SLAC [45] measurements (open black points). |
Phys. Rev. C108, 025201 (2023): downloads png pdf |
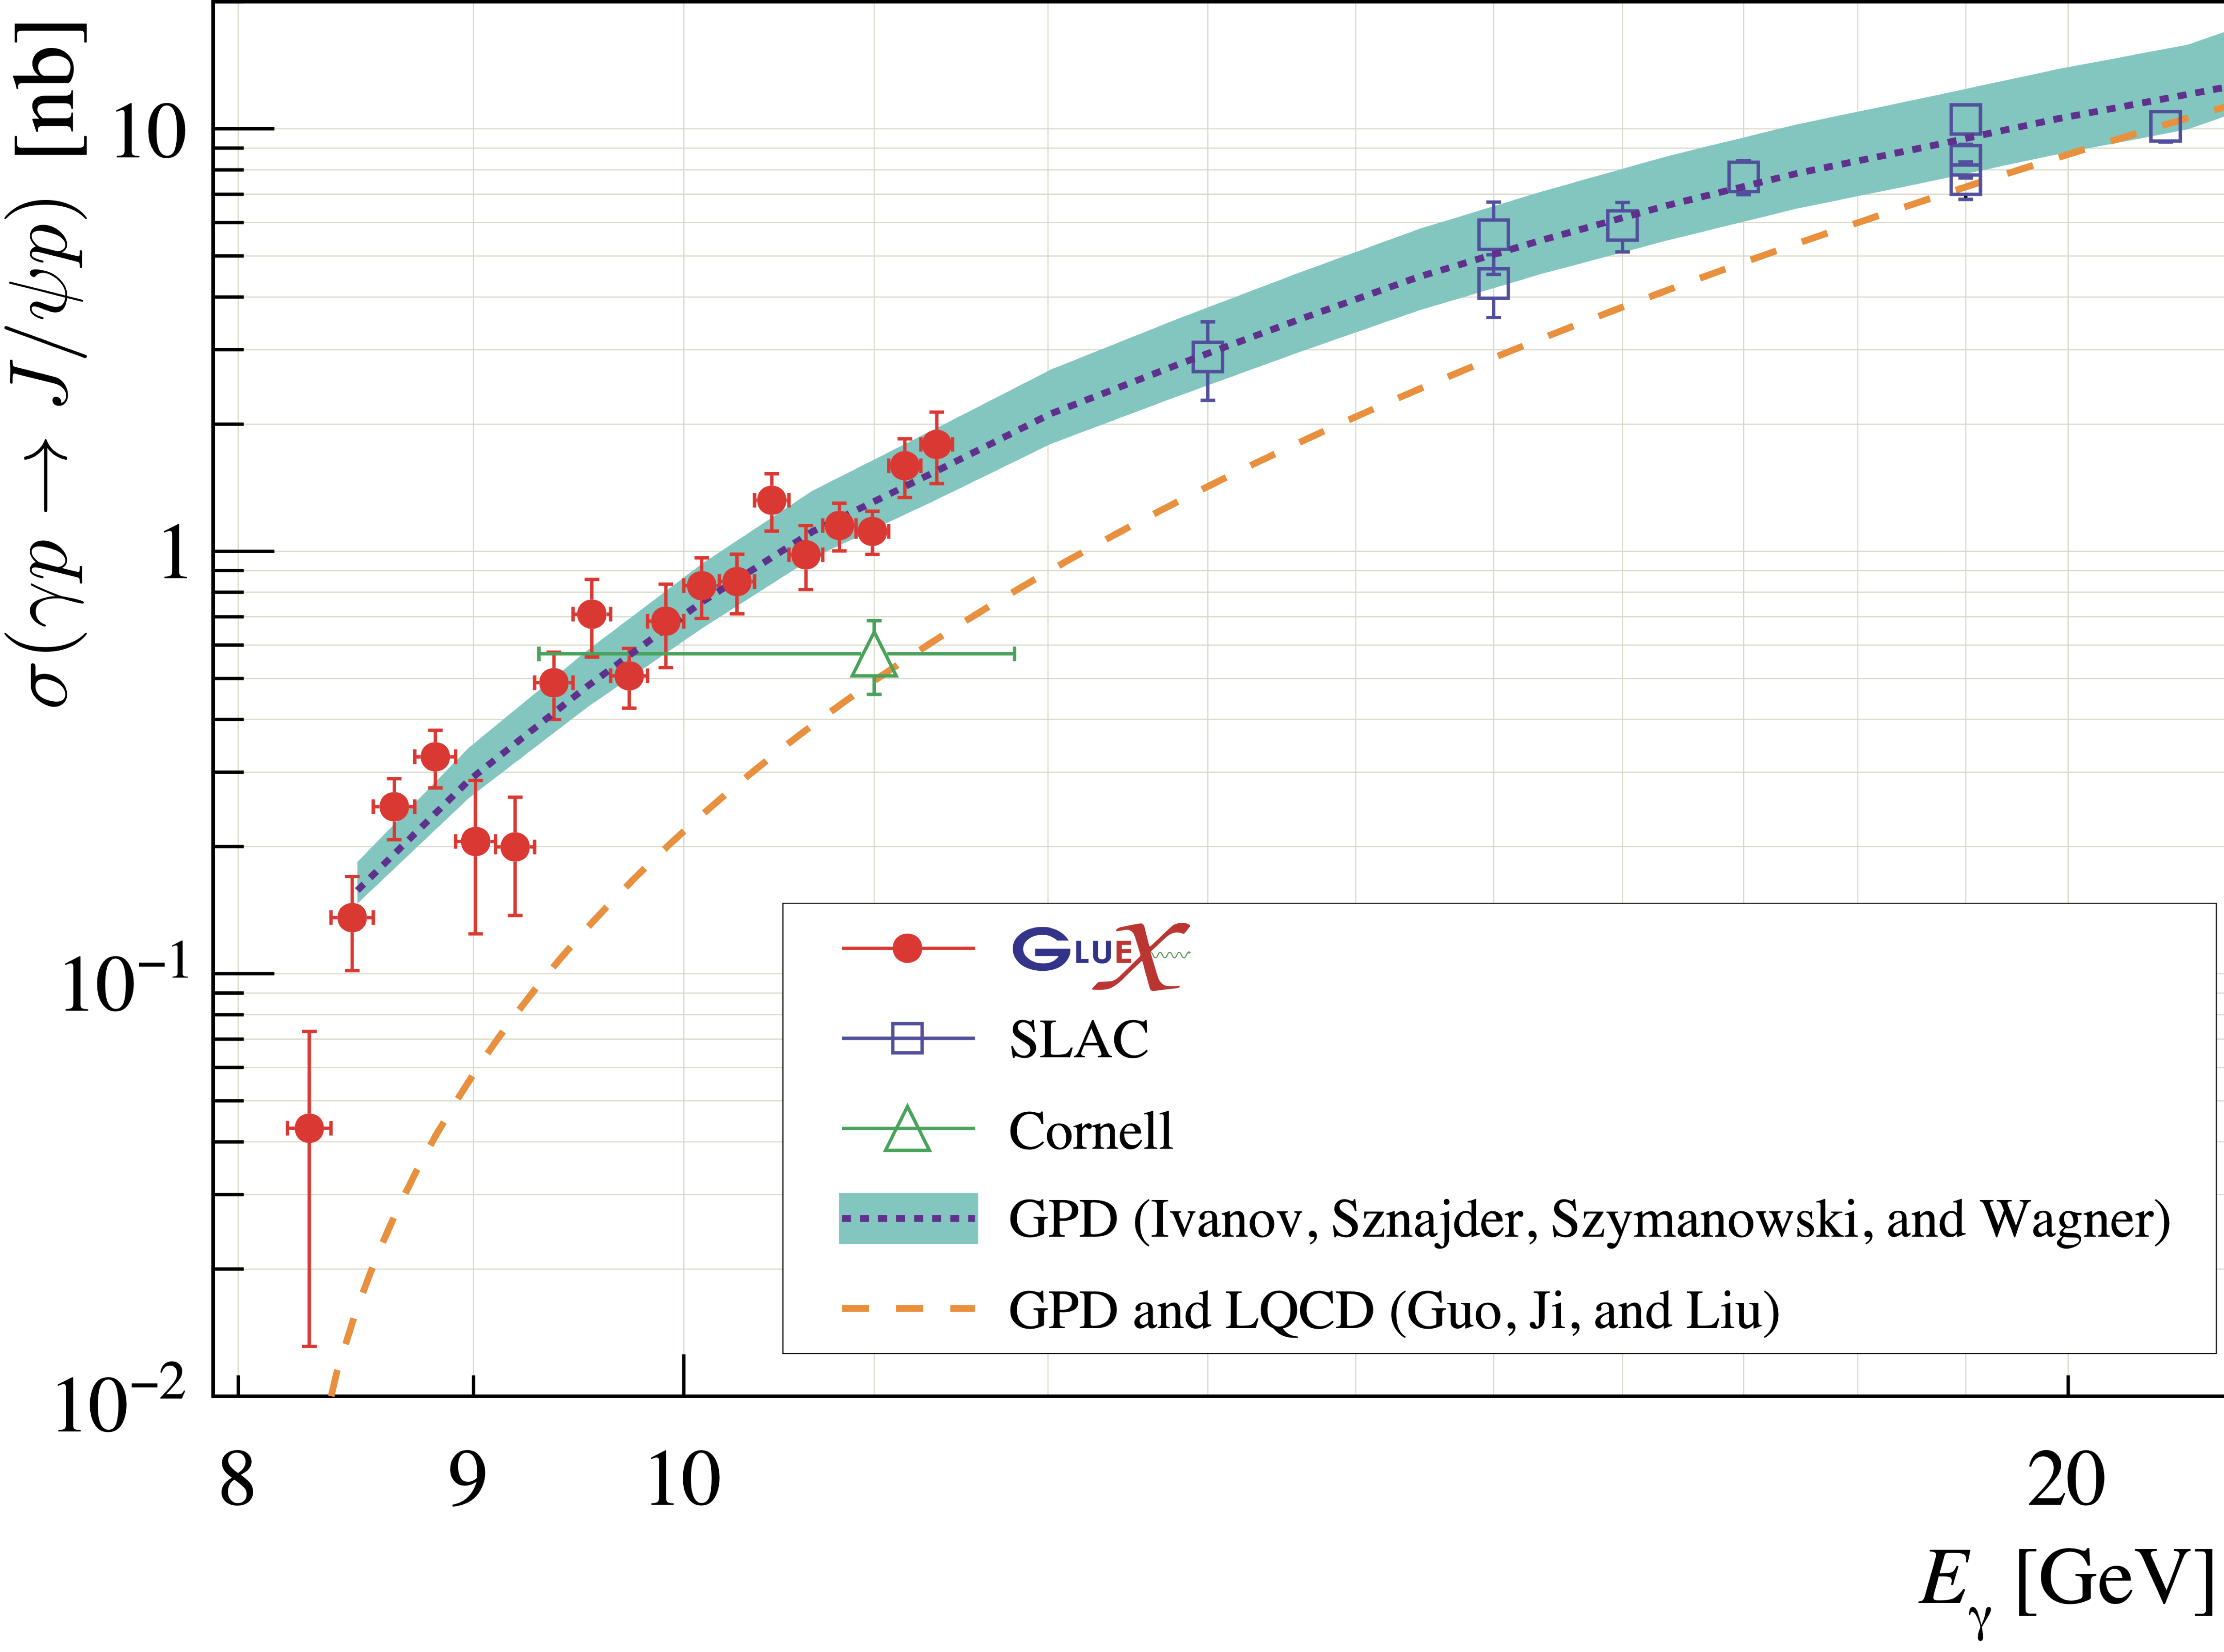
Figure 17:
Comparison of the $J/\psi $ total cross sections from this work (GlueX) to the SLAC [45] and Cornell [47] data and two QCD theoretical calculations in the two-gluon exchange factorization model (in LO) from Ref. [48] and from Ref. [10]. The latter calculation uses gravitational form factors from lattice calculations [44]. The SLAC total cross sections are estimated from their $d\sigma/dt|_{t=t_{min}}$ measurements [45] assuming a dipole $t$-dependence from the fit of our differential cross section at the highest energy, Fig. 15. The error bars shown for the GlueX data are the statistical and systematic errors summed in quadrature. |
Phys. Rev. C108, 025201 (2023): downloads png pdf |
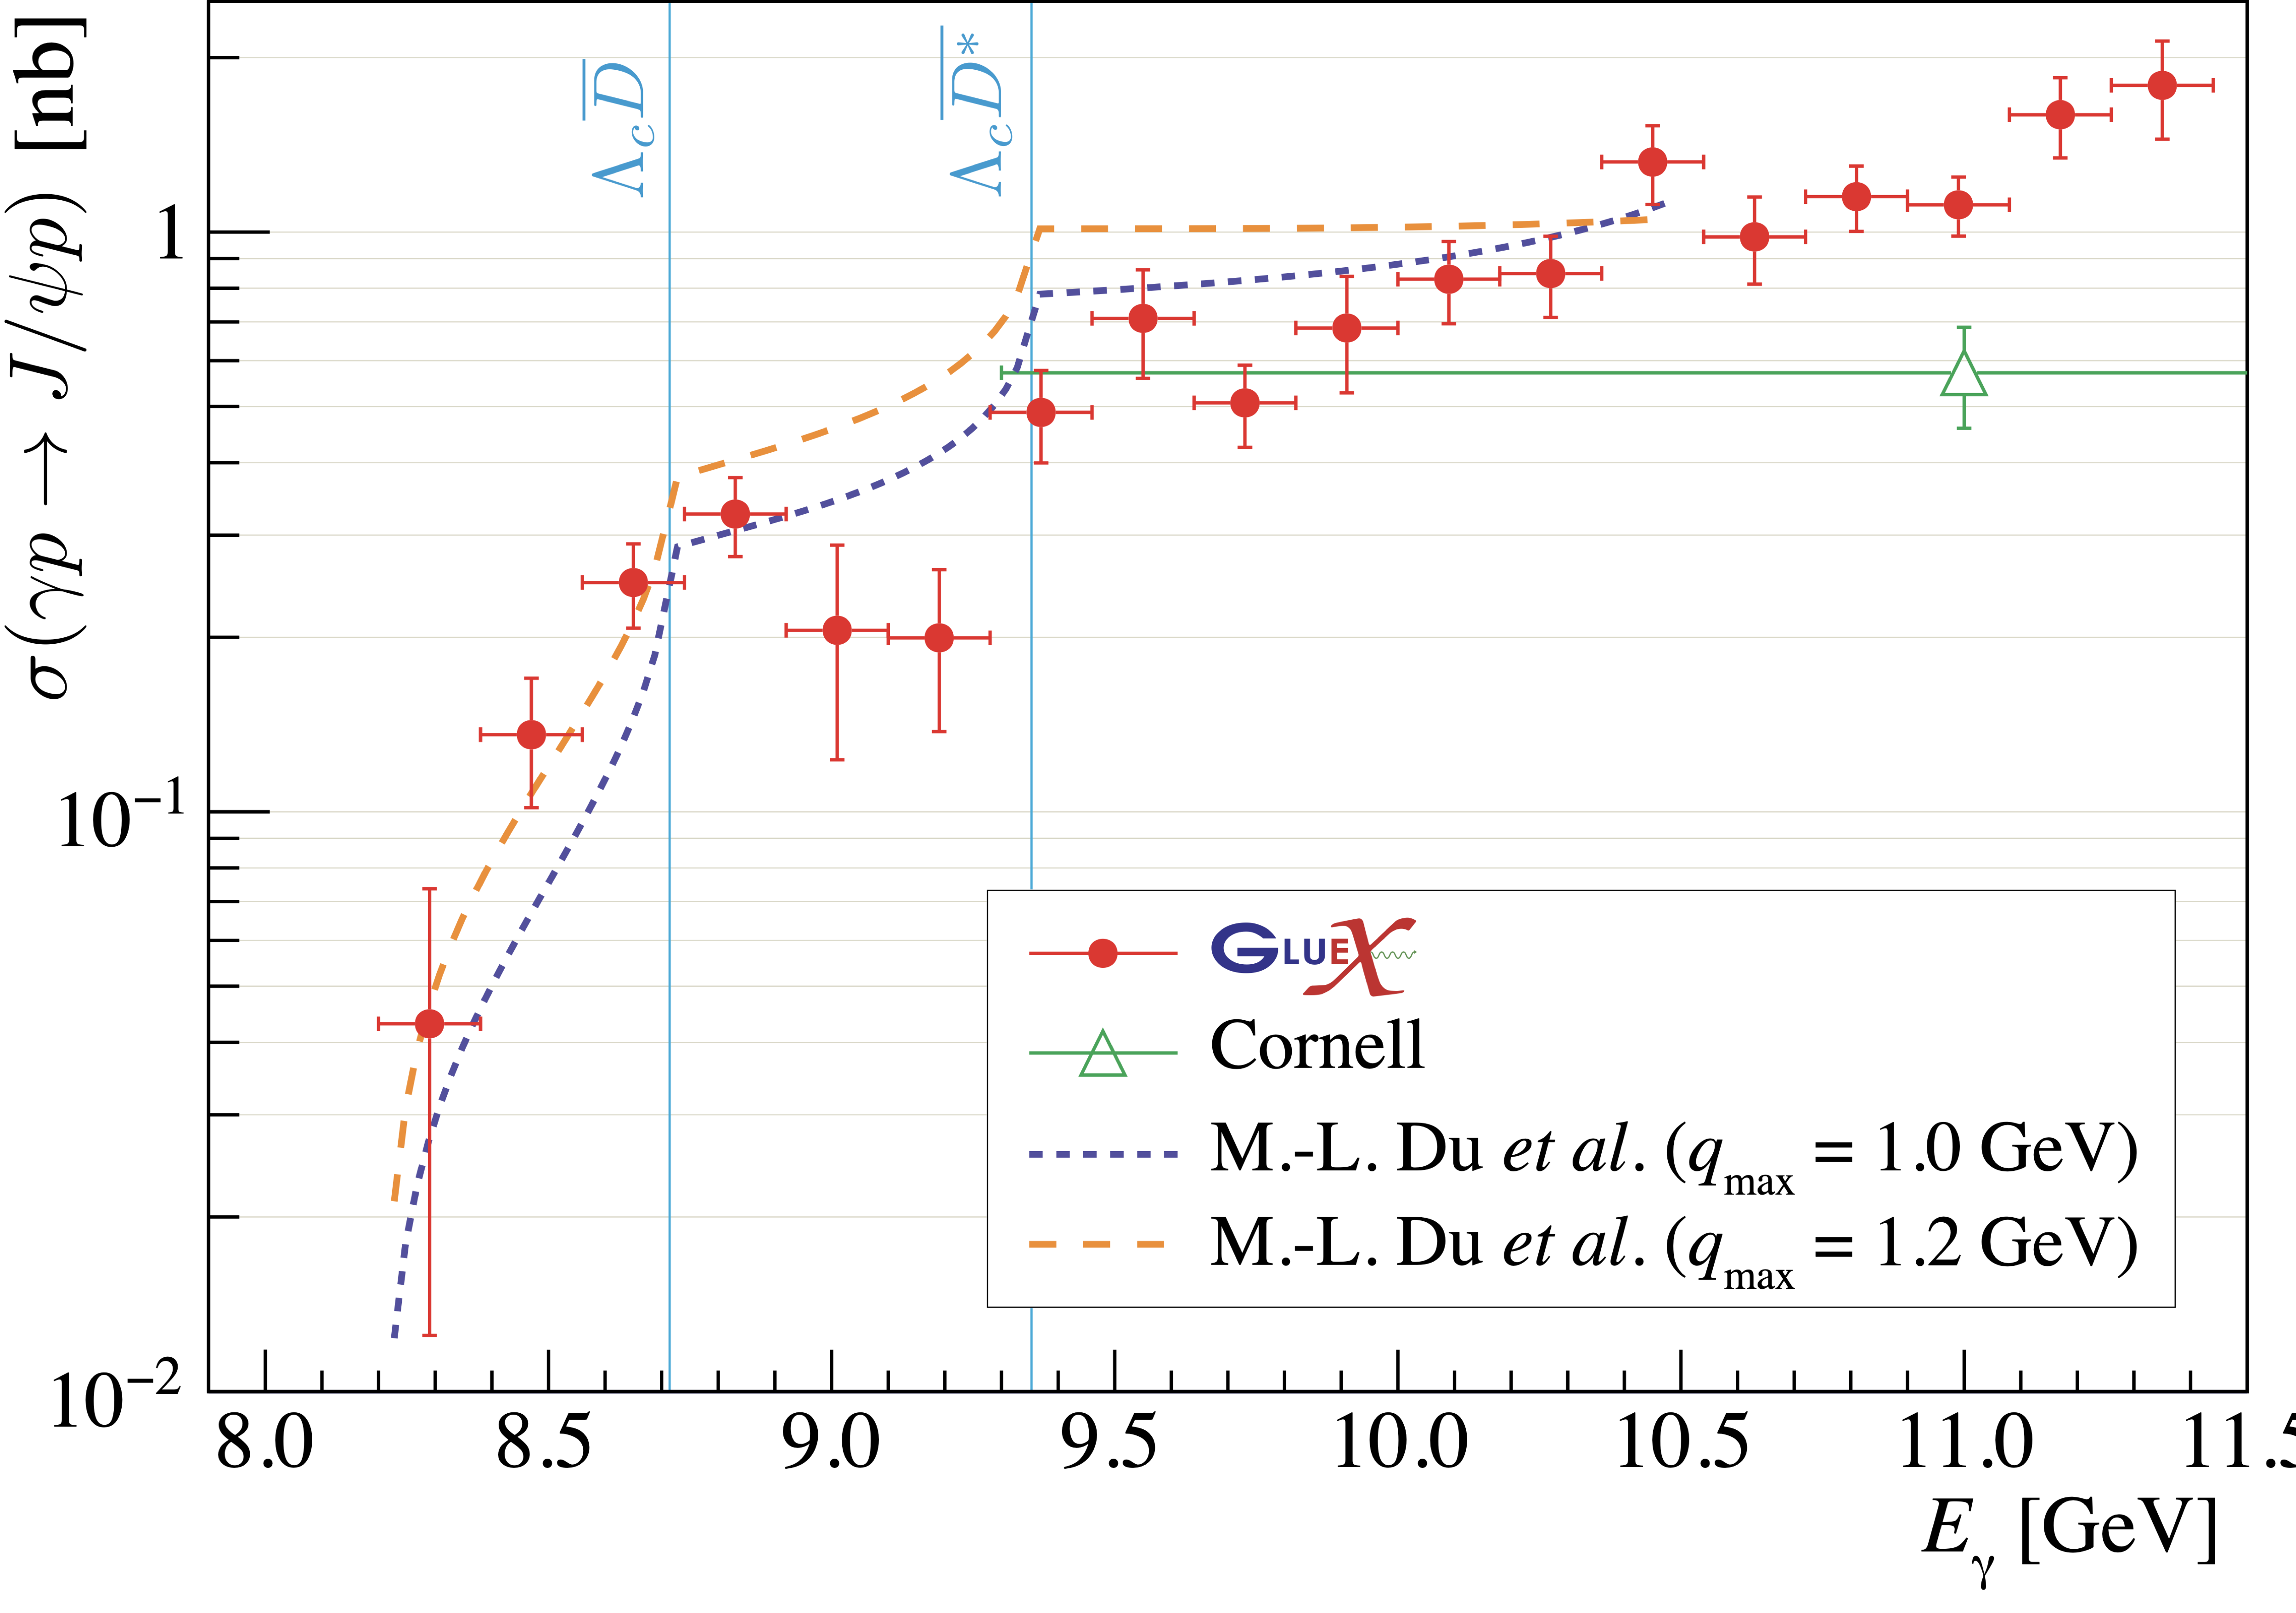
Figure 18:
Comparison of the GlueX $J/\psi $ total cross section to open charm calculations [19]. The thresholds of $\Lambda_c\bar{D}$ ($8.71$ GeV) and $\Lambda_c\bar{D}^*$ ($9.35$ GeV) are shown as vertical lines. The error bars shown for the GlueX data are the statistical and systematic errors summed in quadrature. |