Measurement of Spin Density Matrix Elements in $\Lambda(1520)$ Photoproduction at 8.2-8.8 GeV
Abstract:
We report on the measurement of spin density matrix elements of the $\Lambda(1520)$ in the photoproduction reaction $\gamma p\rightarrow \Lambda(1520)K^+$, via its subsequent decay to $K^{-}p$. The measurement was performed as part of the GlueX experimental program in Hall D at Jefferson Lab using a linearly polarized photon beam with $E_\gamma =$ 8.2-8.8 GeV. These are the first such measurements in this photon energy range. Results are presented in bins of momentum transfer squared, $-(t-t_\text{0})$. We compare the results with a Reggeon exchange model and determine that natural exchange amplitudes are dominant in $\Lambda(1520)$ photoproduction.Journal: Phys. Rev. C105, 035201 (2022)
arXiv: arXiv:2107.12314
HEPdata: link

Phys. Rev. C105, 035201 (2022): downloads png pdf |
Figure 1:
The Gottfried-Jackson system used in this analysis. The diagram on top visualizes the t obreakdash-channel production process expected to dominate at GlueX energies with $X$ being the exchange particle. The Gottfried-Jackson system is defined in the rest frame of the $\Lambda(1520)$ (see Eq. [1]). The polarization vector of the incoming beam photon is denoted by $\epsilon$. |
Phys. Rev. C105, 035201 (2022): downloads png pdf |
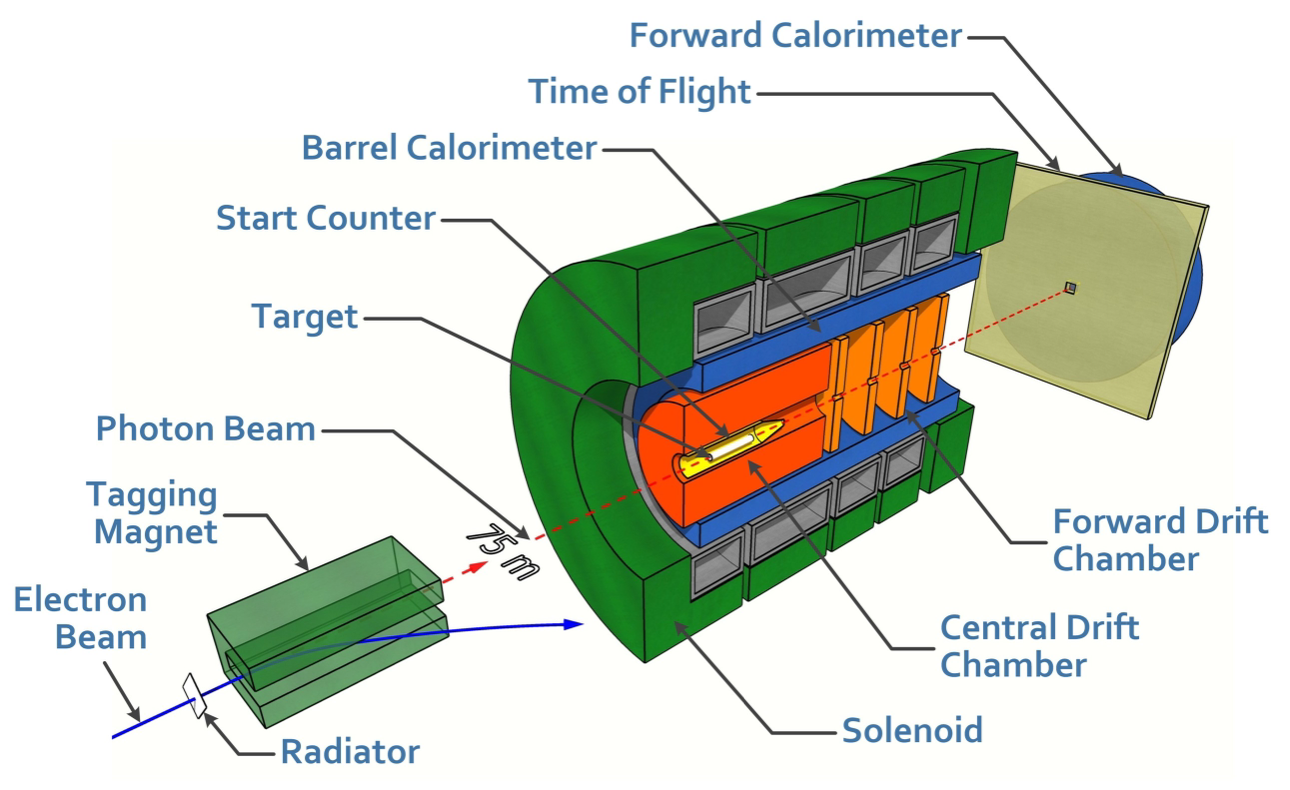
Figure 2:
Overview of the GlueX experiment and its important subdetector systems. Taken from Ref. [16]. |

Phys. Rev. C105, 035201 (2022): downloads png pdf |
Figure 3:
The photon beam polarization is shown for the four separate diamond settings. The measurement carries a systematic uncertainty of 1.5% [17] |
Phys. Rev. C105, 035201 (2022): downloads png pdf |
Figure 4:
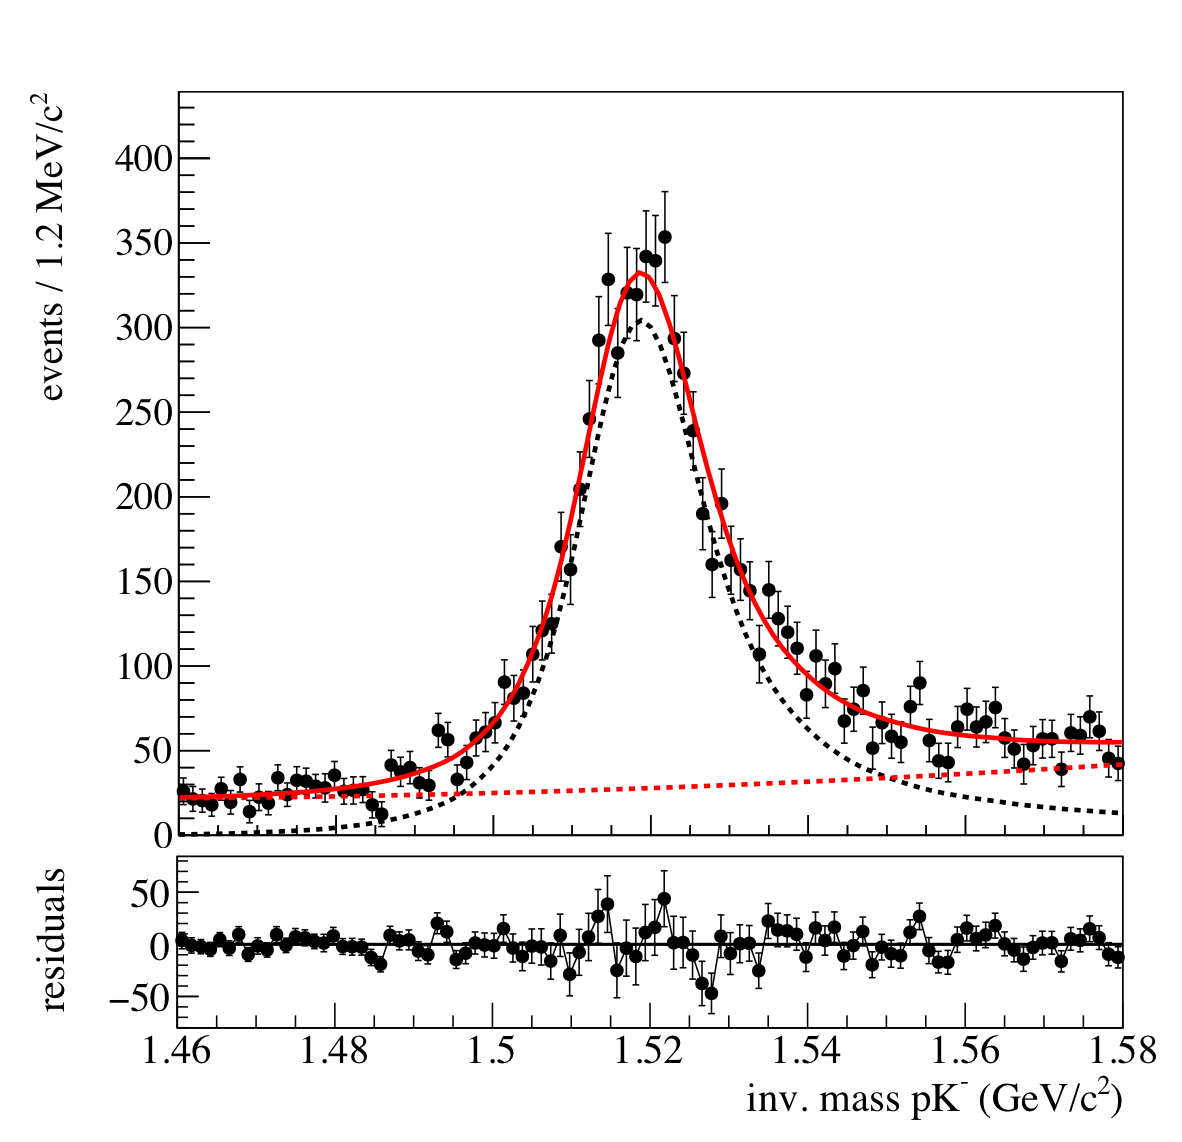
Example sPlot fit [19] for one bin between $-(t-t_\text{0}) = 0.3-0.5$ GeV$^{2}/c^2$. Top, The black and red dashed lines show the fit components of signal and background respectively, the red solid line shows the resulting fit to the data (black points). Bottom, Residuals of the total fit to the data. |

Phys. Rev. C105, 035201 (2022): downloads png pdf |
Figure 5:
Distribution of momentum transfer $-(t-t_\text{0})$ for signal weighted events (blue data points) and acceptance (red line). The black dotted lines indicate the chosen bin limits. |
Phys. Rev. C105, 035201 (2022): downloads png pdf |
Figure 6a:
Projections of data (black points) and simulations containing acceptance effects which were weighted with fit results (red lines) for $-(t-t_\text{0}) = 0.3-0.5$ GeV$^{2}/c^2$. Note, as the red curves are based on simulated data, they are not expected to be perfectly smooth. |
Phys. Rev. C105, 035201 (2022): downloads png pdf |
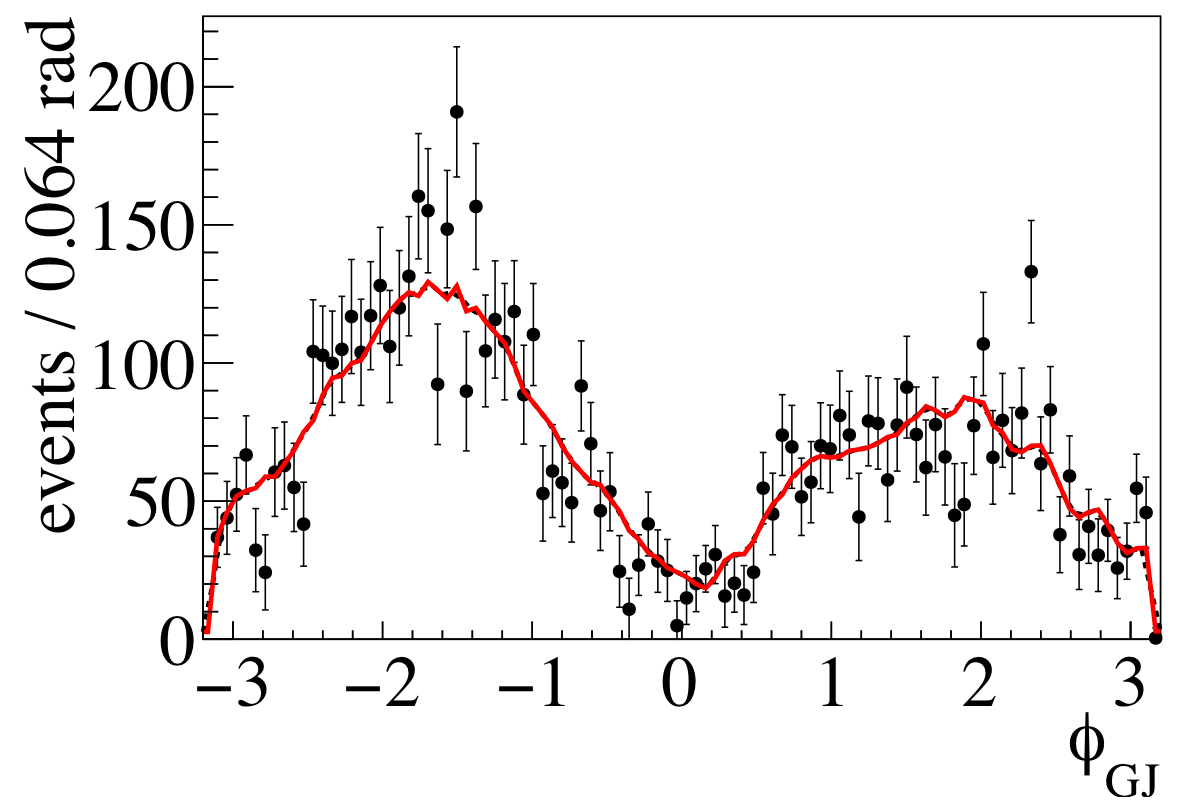
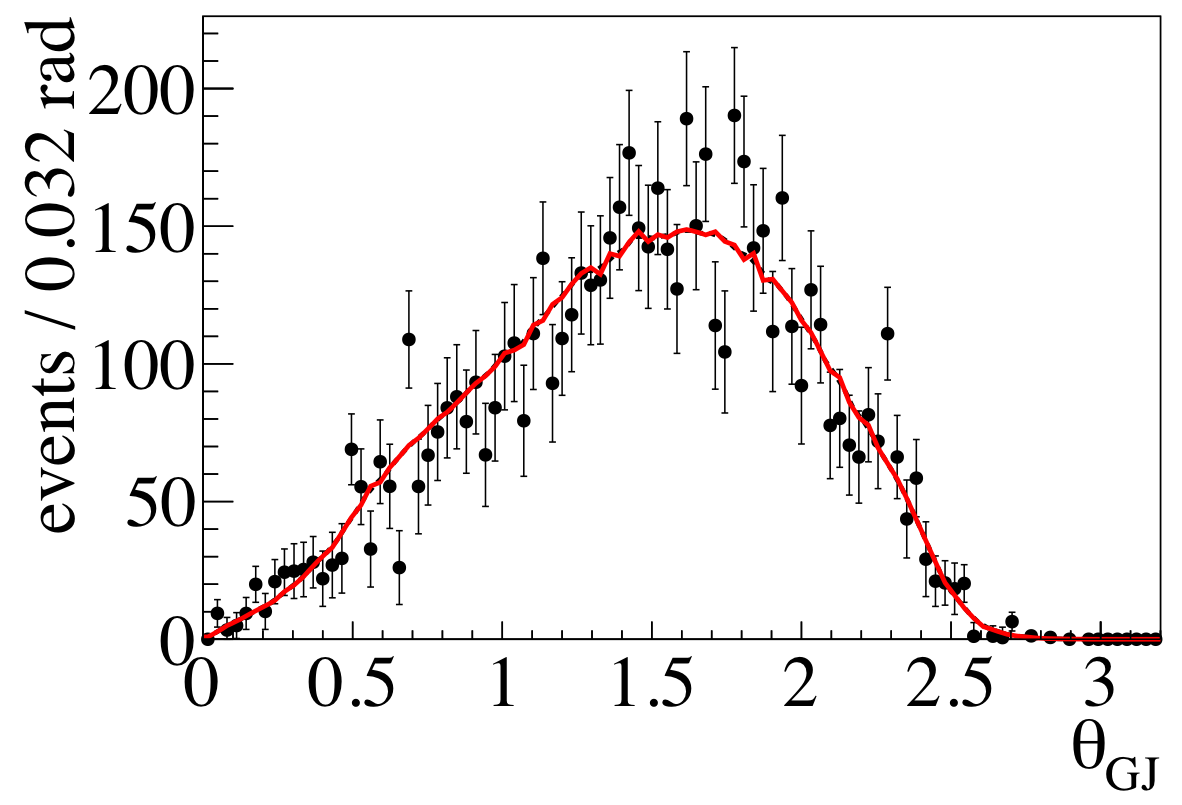
Figure 6b:
Projections of data (black points) and simulations containing acceptance effects which were weighted with fit results (red lines) for $-(t-t_\text{0}) = 0.3-0.5$ GeV$^{2}/c^2$. Note, as the red curves are based on simulated data, they are not expected to be perfectly smooth. |
Phys. Rev. C105, 035201 (2022): downloads png pdf |
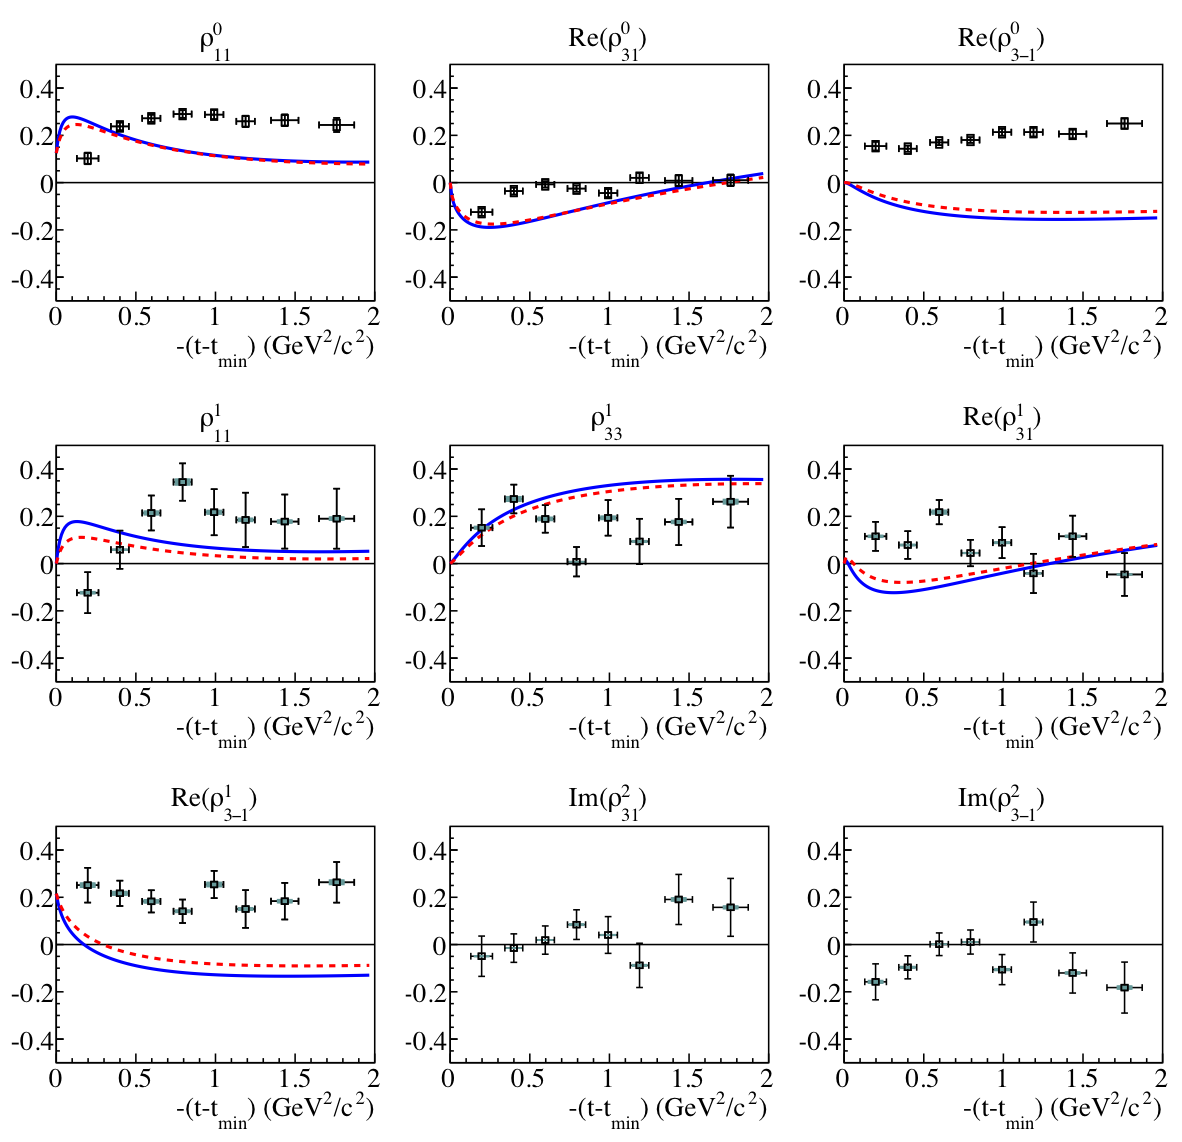
Figure 7:
Spin density matrix elements and predictions by Yu and Kong (based on Ref. [14]), using parameters based on data from CLAS [9] and LEPS [6,7] (blue solid) and using parameters based on data from LAMP2 [5] and SLAC [4] (red dashed). The vertical error bars show the statistical uncertainty, the blue shaded boxes the scaling uncertainty from the polarization, and the black boxes the remaining systematic uncertainties combined in quadrature. The horizontal error bars show the RMS widths within the $-(t-t_0)$ bins. |
Phys. Rev. C105, 035201 (2022): downloads png pdf |
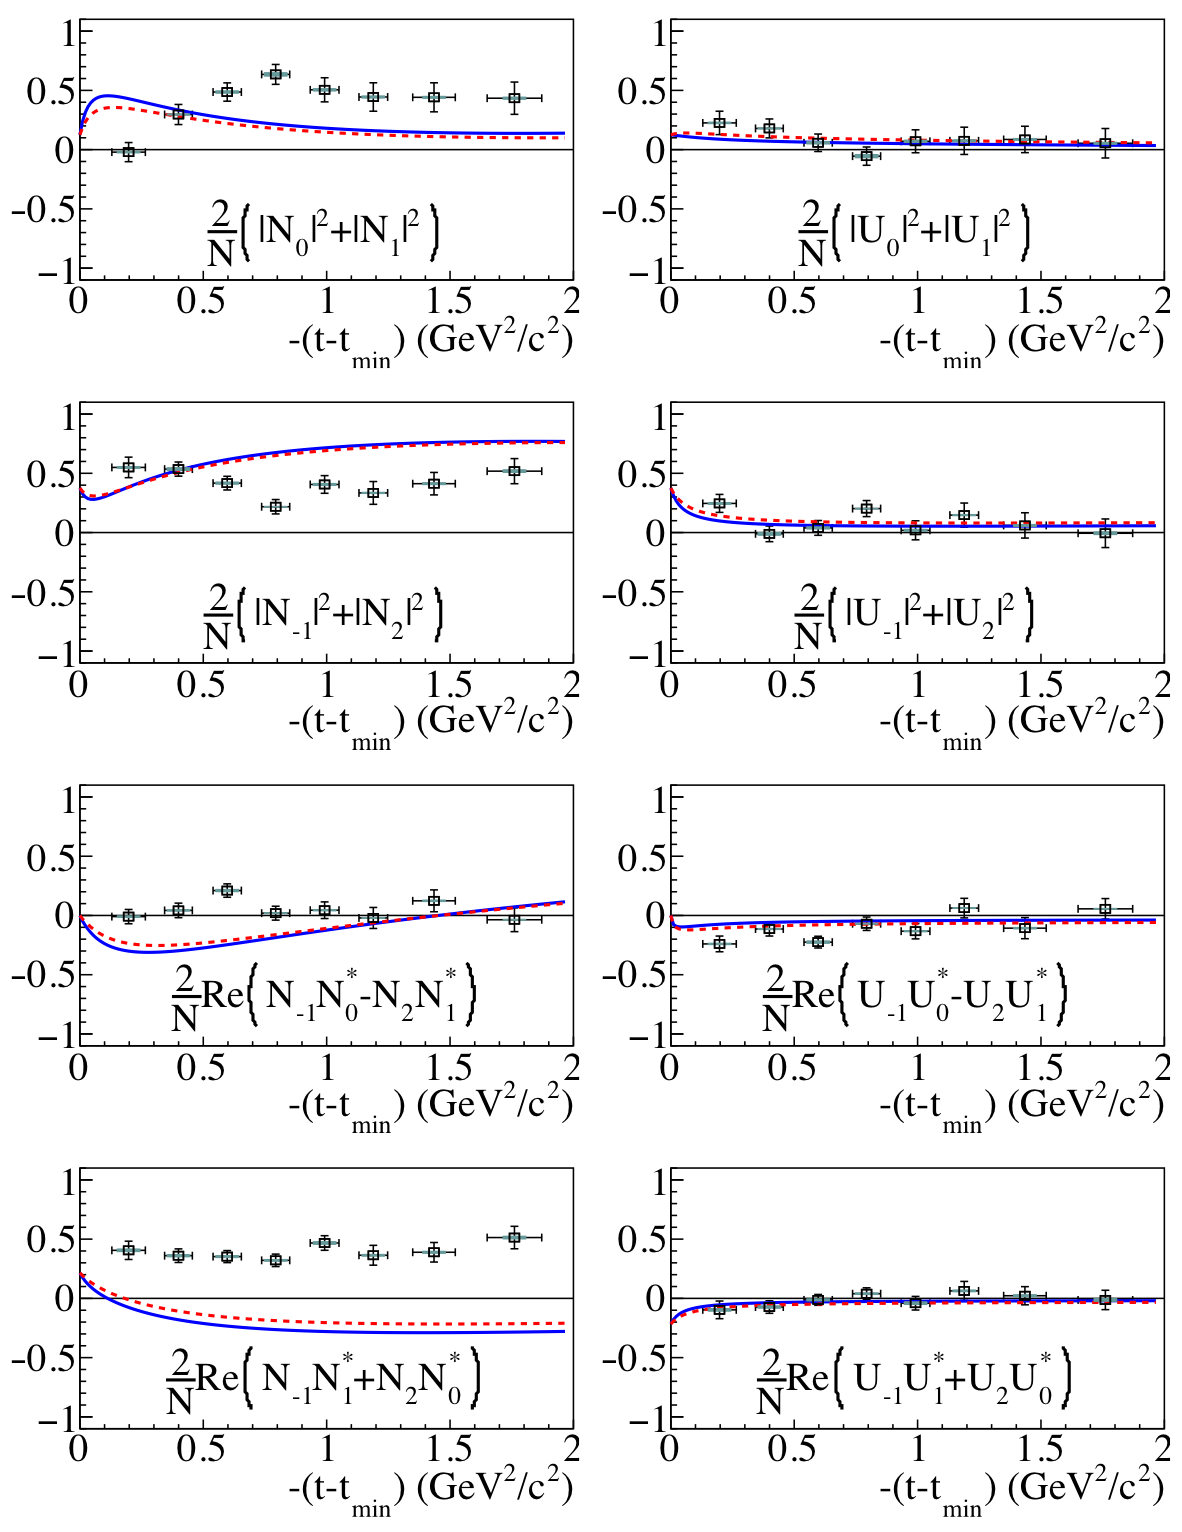
Figure 8:
Combinations of SDMEs corresponding to natural (left column) and unnatural (right column) exchanges in the photoproduction of $\Lambda(1520)$. Also shown are the corresponding combinations of predictions by Yu and Kong (based on Ref. [14]), using parameters based on data from CLAS [9] and LEPS [6,7] (blue solid) and using parameters based on data from LAMP2 [5] and SLAC [4] (red dashed). The vertical error bars show the statistical uncertainty, the blue shaded boxes the scaling uncertainty from the polarization, and the black boxes the remaining systematic uncertainties combined in quadrature. The horizontal error bars show the RMS widths within the $-(t-t_0)$ bins. |