Search for photoproduction of axion-like particles at GlueX
Abstract:
We present a search for axion-like particles, $a$, produced in photon-proton collisions at a center-of-mass energy of approximately 4 GeV, focusing on the scenario where the $a$-gluon coupling is dominant. The search uses $a\to\gamma\gamma$ and $a\to\pi^+\pi^-\pi^0$ decays, and a data sample corresponding to an integrated luminosity of 168 pb$^{-1}$ collected with the \gluex detector. The search for $a\to\gamma\gamma$ decays is performed in the mass range of $180 < m_a < 480$ MeV, while the search for $a\to\pi^+\pi^-\pi^0$ decays explores the $620 < m_a < 720$ MeV region. No evidence for a signal is found, and 90% confidence-level exclusion limits are placed on the $a$-gluon coupling strength. These constraints are the most stringent to date over most of the mass ranges considered.Journal: Phys. Rev. D105, 052007 (2022)
arXiv: arXiv:2109.13439
HEPdata: link

Phys. Rev. D105, 052007 (2022): downloads png pdf |
Figure 1a:
Fits to the (top) $\gamma\gamma$ and (bottom) $\pi^+\pi^-\pi^0$ invariant mass spectra after applying the accidental subtraction used to determine the $\pi^0$ and $\eta$ yields (shown here integrated over $t$). The blue dashed line shows the $\pi^0$ component; the cyan dotted lines show the $\eta$ components; the green dashed-dotted lines show the $\omega$ components; and the magenta dashed-double-dotted line shows the linear (power-law) background for the $\gamma\gamma$ ($\pi^+\pi^-\pi^0$) channel. The red solid lines show the sum of all contributions. The residuals account for both the statistical and modeling uncertainties. |
Phys. Rev. D105, 052007 (2022): downloads png pdf |
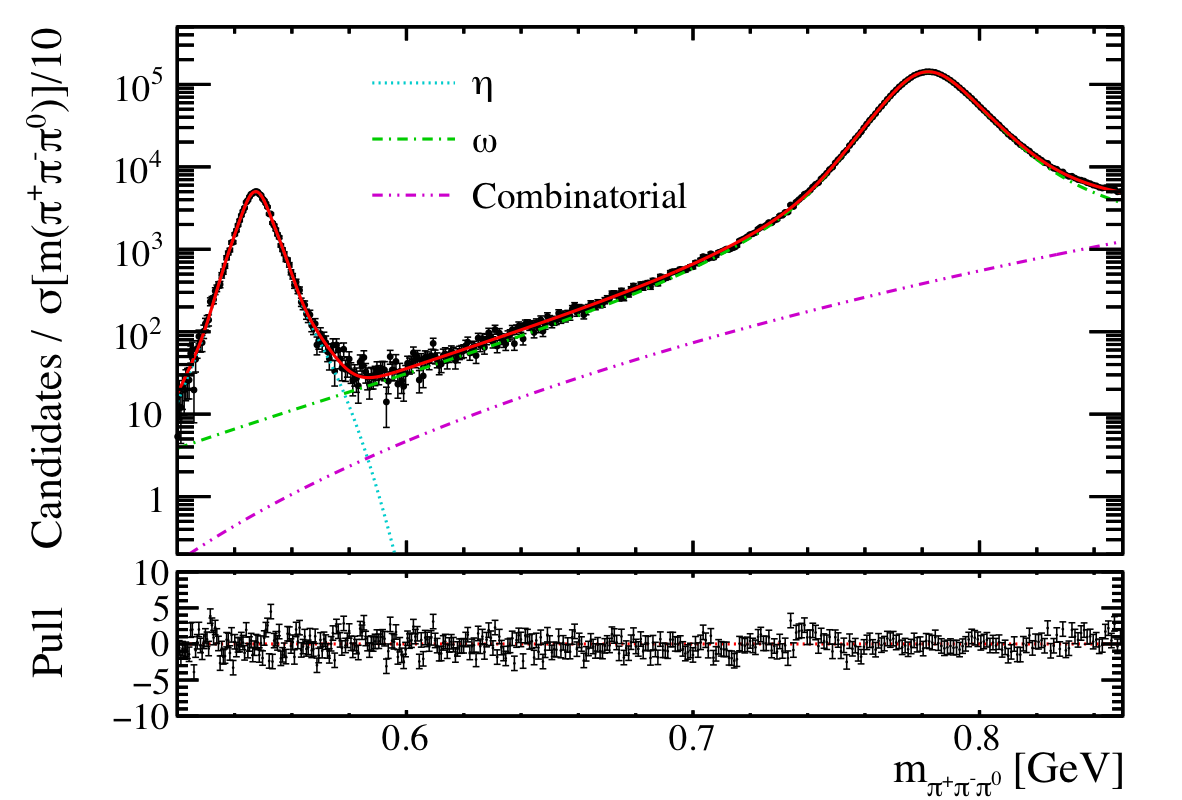
Figure 1b:
Fits to the (top) $\gamma\gamma$ and (bottom) $\pi^+\pi^-\pi^0$ invariant mass spectra after applying the accidental subtraction used to determine the $\pi^0$ and $\eta$ yields (shown here integrated over $t$). The blue dashed line shows the $\pi^0$ component; the cyan dotted lines show the $\eta$ components; the green dashed-dotted lines show the $\omega$ components; and the magenta dashed-double-dotted line shows the linear (power-law) background for the $\gamma\gamma$ ($\pi^+\pi^-\pi^0$) channel. The red solid lines show the sum of all contributions. The residuals account for both the statistical and modeling uncertainties. |
Phys. Rev. D105, 052007 (2022): downloads png pdf |
Figure 2a:
Signed local significances at each scan mass from (black points) all fits and (red lines) the expected distribution for the (top) $\gamma\gamma$ and (bottom) $\pi^+\pi^-\pi^0$ channels; if the best-fit signal-yield estimator is negative, the signed significance is negative and vice versa. The error bars account for the correlation between nearest-neighbor fit results, which often produces outliers in pairs due to the $\sigma(m)/2$ step size. |

Phys. Rev. D105, 052007 (2022): downloads png pdf |
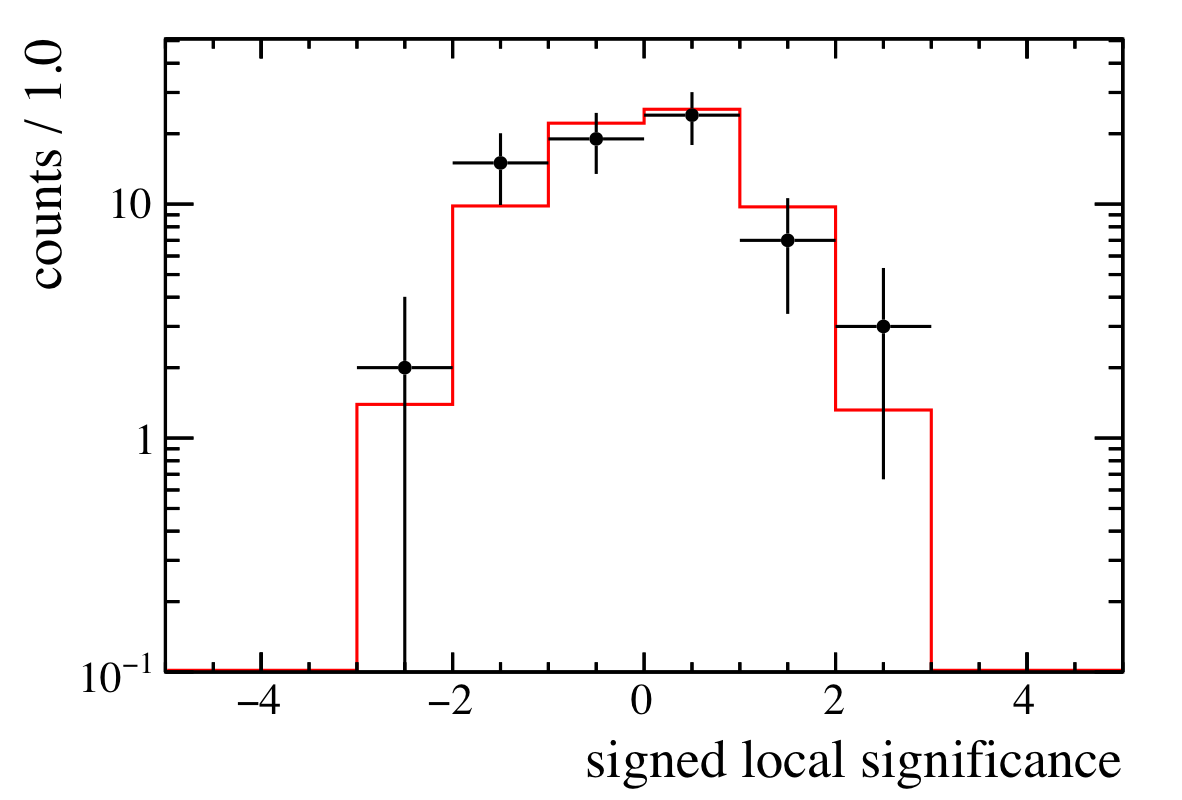
Figure 2b:
Signed local significances at each scan mass from (black points) all fits and (red lines) the expected distribution for the (top) $\gamma\gamma$ and (bottom) $\pi^+\pi^-\pi^0$ channels; if the best-fit signal-yield estimator is negative, the signed significance is negative and vice versa. The error bars account for the correlation between nearest-neighbor fit results, which often produces outliers in pairs due to the $\sigma(m)/2$ step size. |

Phys. Rev. D105, 052007 (2022): downloads png pdf |
Figure 3a:
Products of the acceptance and efficiency in bins of $t$ and $m_a$ for (top) $a \to \gamma\gamma$ and (bottom) $a \to \pi^+\pi^-\pi^0$ decays. |

Phys. Rev. D105, 052007 (2022): downloads png pdf |
Figure 3b:
Products of the acceptance and efficiency in bins of $t$ and $m_a$ for (top) $a \to \gamma\gamma$ and (bottom) $a \to \pi^+\pi^-\pi^0$ decays. |
Phys. Rev. D105, 052007 (2022): downloads png pdf |
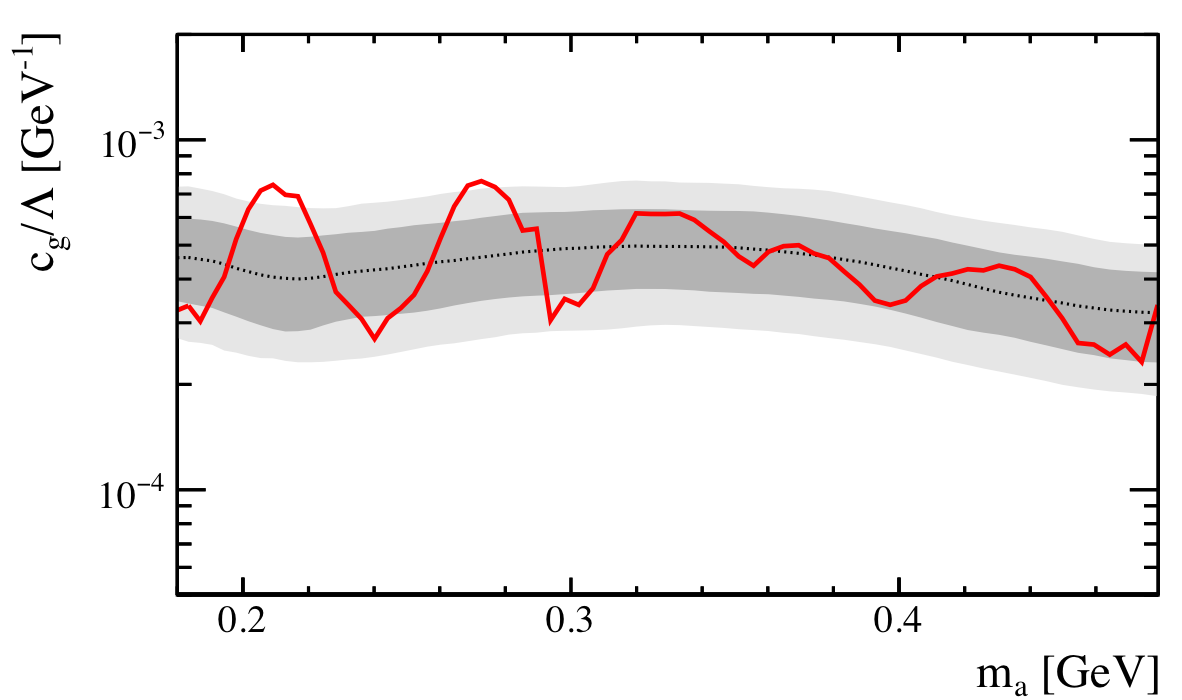
Figure 4a:
Exclusion limits at 90% CL (red solid) from this search compared to the expected sensitivity (dashed) from (top) $\gamma\gamma$ and (bottom) $\pi^+\pi^-\pi^0$ channels. The (dark shaded) $\pm 1\sigma$ and (light shaded) $\pm 2\sigma$ regions are also shown. |
Phys. Rev. D105, 052007 (2022): downloads png pdf |
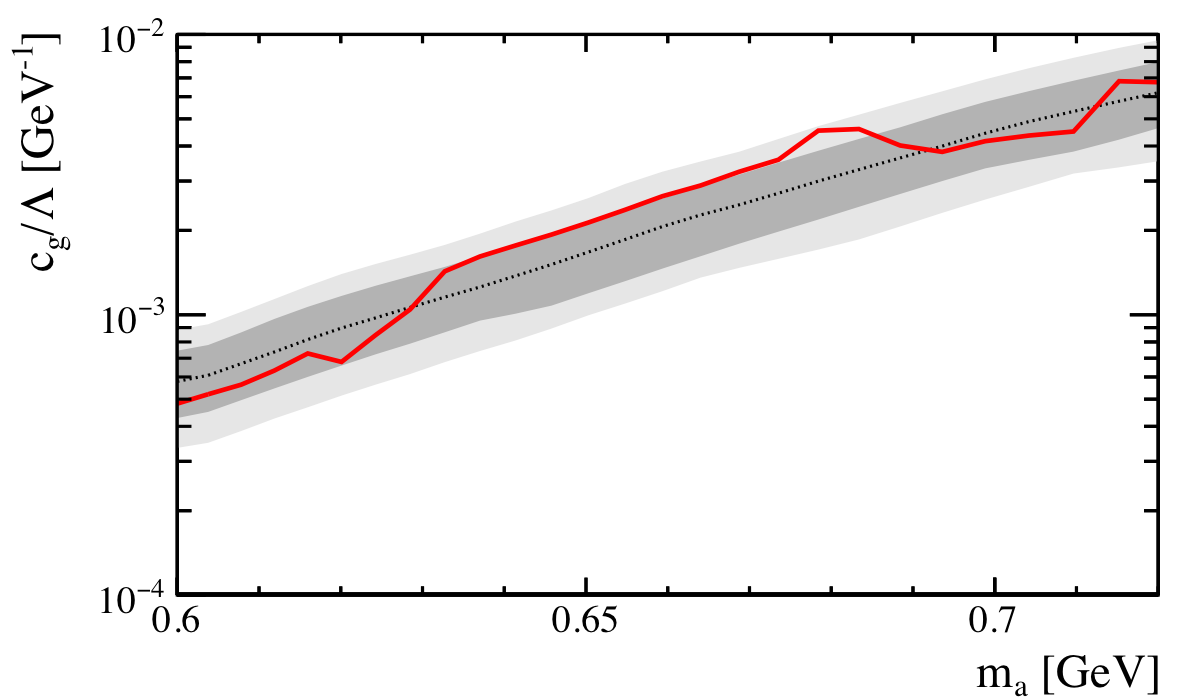
Figure 4b:
Exclusion limits at 90% CL (red solid) from this search compared to the expected sensitivity (dashed) from (top) $\gamma\gamma$ and (bottom) $\pi^+\pi^-\pi^0$ channels. The (dark shaded) $\pm 1\sigma$ and (light shaded) $\pm 2\sigma$ regions are also shown. |
Phys. Rev. D105, 052007 (2022): downloads png pdf |
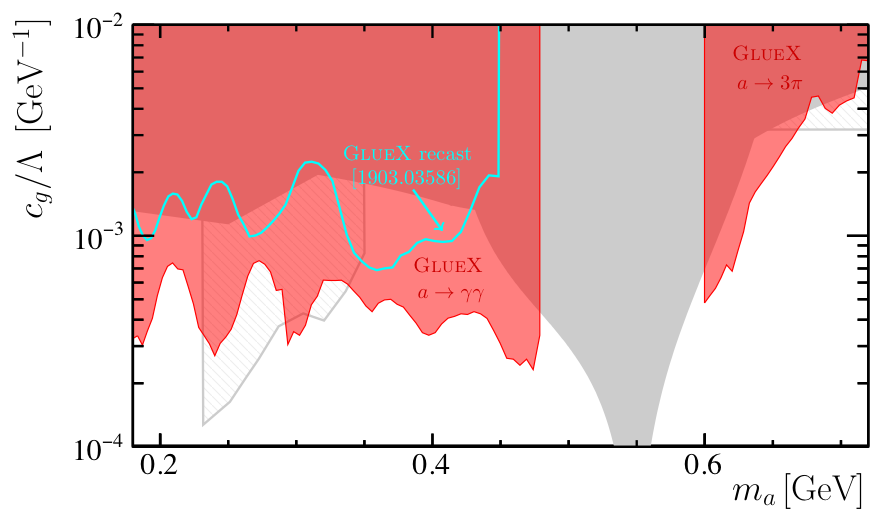
Figure 5:
Results from (red) this search compared to the (gray) previous bounds [19] from LEP [51,52], $\phi$ and $\eta'$ decays [31], and the (cyan line) \gluex limits recasted from Ref. [30]. In addition, limits obtained from kaon decays [19,50,53-55] and the $B$-meson lifetime [19,50], which have $\mathcal{O}(1)$ uncertainties induced by the unknown UV physics, are shown as hashed regions. |